I’ve tried REW with some pro-audio interfaces and Mac OS (with java 1.8). But I am seeing inconsistent results in the high end frequency response form ~10K to 20K (top octave) depending upon the connection type. I will note that the loopback test for both interfaces show the interfaces frequency and phase response are ruler flat with only a slight phase shift below 5 Hz. and near the Nyquist frequency. Nothing changed during the sweep tests with anything positioned in the room, the room treatments, or the equipment used (other than the interface and connection to the machine). So neither the frequency response of the interfaces or the room setup would seem to account for a ~5 -15 dB difference in frequency response above 10K; it appears to be a function of how the interface is connected.
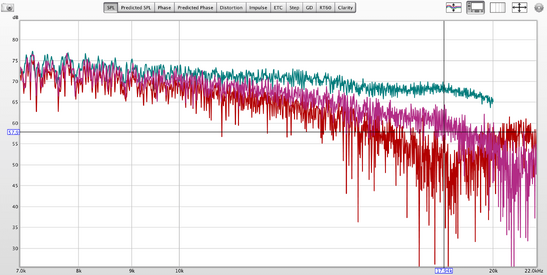
I started with a Mac running 10.12.6 with a Firewire 400 connection to a Metric Halo LIO8 interface. This yielded the flattest response from 10K to 20K and seems to be most consistent with how the room sounds and is treated. This is the relatively flat top green trace with the least amount of HF hash. There is nothing else using the FW buss.
The middle pink trace is with an Apogee Symphony I/O connected via its matching PCIe card (which provides a higher speed connection than FW). This is with Mac OS 10.11. But despite the lower latency, the high frequency response is skewed to be ~10 dB lower by the time it hits ~20K. REW recognizes the symphony hardware as both input and output devices.
The red trace is with the same Metric Halo LIO 8 but this time upgraded from the 2d card to the 3d card which replaces the Firewire 400 connection with a USB C connection and also audio over ethernet via a Mac driver. The USB C connection has by far the most HF skew and is down by ~20 dB at about 18K. This happens with Mac OS 10.12.6, or Mac OS 10.13.6. REW recognizes the USB C connection as both an input and output device. But REW recognizes the ethernet audio connection as a network audio device for output only; it does not recognize it as an input device. So I could not use REW with the ethernet connection. The pink and red traces were done at higher sampling rates, but in the end this made no difference.
I can understand that lower speed connections between the interface and the computer might cause timing issues with higher frequency data (for the same buffer sizes and data windowing setup). Or time skew for HF data might be the worst in the top octave. But these traces seem to show the opposite; the HF skew is worse for the faster connections and the slowest FW 400 connection has the flattest trace. So this makes me wonder if REW is not setup to work with high speed interfaces that use PCIe and USB C/USB 3.0 connections.
Finally, without knowing what the room sounds like, I don’t think it would be clear to the casual user what trace represents the true response of the room, i.e., there is no indication from REW that anything went wrong with running any of the 3 traces. Or if you did not have the opportunity to use different hardware connections, you might never question the plot of the top octave (BTW - it was easy to align the amplitude of all the traces in the overlay window at the lower frequencies where they match up).