






Help with Think Pad

WntrMute2

Registered
Thread Starter
Joined
Jan 29, 2018
Posts
4
Forgive me if this has been dealt with before.
I have a ThinkPad without a line in port. I am trying to create the soundcard calibration file needed. I have the Dayton calibration file downloaded for the USB microphone but don't know how to proceed. Any help would be appreciated.
I am trying to learn something regarding my two channel system and a new subwoofer.
Thanks in advance
Dave
Did not mean for this to be a sticky.
 
Does the same thing apply to the SPL calibration? When I try and calibrate the SPL a message pops up stating I dont need to do that due to the calibrated microphone. I never remember seeing that message before.

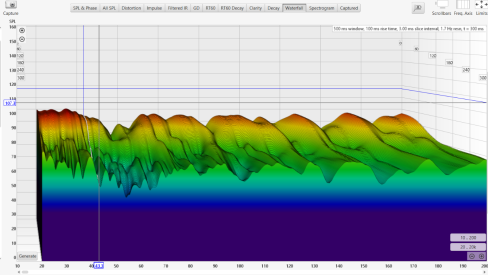
Also, is there a standard graph format to submit for questions. My waterfall plots look like they need help. The decay time seems extraordinarily Screenshot 2026-09-23 121243.png long.
Screenshot 2026-09-23 121243.png
 
Last edited:
In general, graphs should be displayed so that there is no wasted space above and below the graphs. With your waterfall, the vertical scale is too large, it spans from 0dB to 160dB. If you look at your data, a more sensible vertical scale would be 50dB - 100dB.

Even though your graph is difficult to read, I can see that at about 180Hz, the SPL drops by about 20dB and then goes to a flat line. This is fairly typical of a measurement with a poor signal to noise ratio. It will be more evident if you selected a proper vertical scale and extended the time to say 500-1000ms.

Please download and read my REW interpretation guide (it's free). It was written to help people like you. It will also tell you how to improve your SNR, if that is indeed your problem.
 
That is better, but please read and follow every last detail. I also said, "extend time window to 1000ms". You will see something like this:

1790294508786.png


NOW you can clearly see what is noise and what isn't. In this case the noise floor is about -40dB to the signal with a tone at about 50Hz, possibly a ground loop. You can also see typical behaviour at different frequencies. High frequencies decay smoothly, low frequencies decay in a "lumpy" way. That lumpy decay can be very difficult to distinguish from environmental noise, especially because the frequency response in most systems drops at the bass region, there are dips which further worsen the SNR, AND because noise usually rises at low frequencies because rooms are low-pass filters.

Many people like using the waterfall to examine decay. It might just be my preference, but I don't. IMO the RT60 Decay view is much better. And also the spectrogram. I only use the waterfall to see where the noise floor is before I switch to another view.

The logarithmic sine wave sweep used by REW is designed to improve the SNR. That is its primary advantage over other types of test signals. Please take a look at that book, it will tell you how to recognize noise and what you can do about it.
 
Back
Top