


-
AUDIO VIDEO PROCESSING, SETUP & ENVIRONMENTOfficial REW (Room EQ Wizard) Support Forum Audiolense User Forum Calibration Equipment Auto-EQ Platforms / Immersive Audio Codecs Video Display Technologies / Calibration AV System Setup and Support Listening Room / Home Theater Build Projects Room Acoustics and Treatments AV Showcase Movies / Music / TV / Streaming
-
AUDIO VIDEO DISCUSSION / EQUIPMENTHome Theater / Audio and Video - Misc Topics Essence For Hi Res Audio AV Equipment Advice and Pricing Awesome Deals and Budget AV Equipment AV Receivers / Processors / Amps UHD / Blu-ray / CD Players / Streaming Devices Two Channel Hi-Fi Equipment DIY Audio Projects Computer Systems - HTPC / Gaming HD and UHD Flat Screen Displays Projectors and Projection Screens AV Accessories Buy - Sell - Trade
Navigation
Install the app
How to install the app on iOS
Follow along with the video below to see how to install our site as a web app on your home screen.
Note: This feature may not be available in some browsers.
More options
You are using an out of date browser. It may not display this or other websites correctly.
You should upgrade or use an alternative browser.
You should upgrade or use an alternative browser.
Graph psychoacustic
- Thread starter Alpi
- Start date

John Mulcahy
REW Author
- Joined
- Apr 3, 2017
- Posts
- 9,388
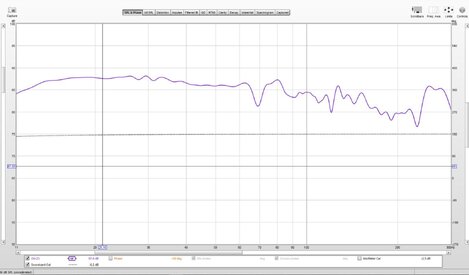
Psychoacoustic smoothing is an approximation to the perceived balance. Variable smoothing is a better choice for making corrections.
John Mulcahy
REW Author
- Joined
- Apr 3, 2017
- Posts
- 9,388
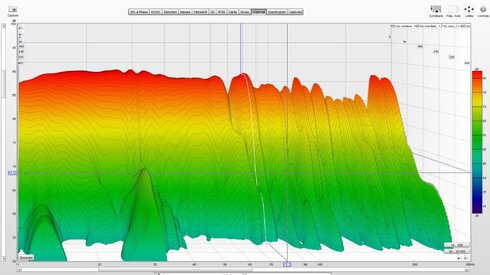
The wavelet spectrogram is useful for time alignment of drive units or speakers and subwoofers.
Alpi
Member
Thread Starter
- Joined
- Feb 21, 2018
- Posts
- 80
Hello John
Thank you for the explanation.
I have four measurements of my home theater here.
Measured is the left speaker + the double bass array (2x4) + my infrasub woofer 4x18 "Dayton.
The crossover from the infrasubwoofer to the DBA is 35HZ and the crossover from the DBA to the left main speaker is 100Hz.
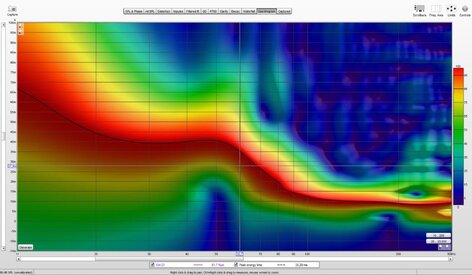
what do the four measurements show you and why is the RT60 so bad even though the waterfall is good (<300ms) and RT60 (700ms)?
Thank you very much
Thank you for the explanation.
I have four measurements of my home theater here.
Measured is the left speaker + the double bass array (2x4) + my infrasub woofer 4x18 "Dayton.
The crossover from the infrasubwoofer to the DBA is 35HZ and the crossover from the DBA to the left main speaker is 100Hz.
what do the four measurements show you and why is the RT60 so bad even though the waterfall is good (<300ms) and RT60 (700ms)?
Thank you very much
Attachments
John Mulcahy
REW Author
- Joined
- Apr 3, 2017
- Posts
- 9,388
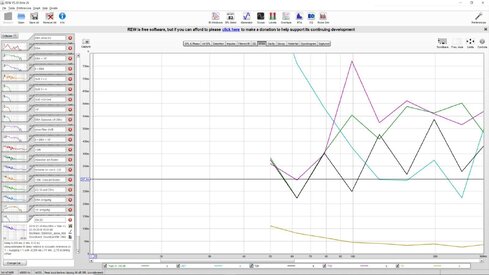
Please post mdat files rather than images. RT60 is meaningless below the rooms' transition band, which is around 200 Hz for domestically sized rooms.
John Mulcahy
REW Author
- Joined
- Apr 3, 2017
- Posts
- 9,388
Thanks. The spectrogram shows the mids lagging the tweeter by 0.7 ms or thereabouts, then a much larger lag of about 9 ms to the bass region. The treble could be delayed to better align with the mid and both could be delayed to better align with the bass, though the audibility of such timing offsets is a topic of debate.

John Mulcahy
REW Author
- Joined
- Apr 3, 2017
- Posts
- 9,388
Not so easily, the Group Delay plot when using a frequency-dependent window of 5 or 6 cycles width comes closest.
Alpi
Member
Thread Starter
- Joined
- Feb 21, 2018
- Posts
- 80
Hello John, where are you from? Texas?
I am from Tyrol :-)
With REW you've done something great, unfortunately I understand only a little. OK. I understand SPL, Waterfall, etc., but there are such great features in REW. is the waterfall under 100 Hz real? Or only calculated?
I'm writing something to my speakers, these are 2 way speakers with a 12 "TT and 1" HT horn.
Thanks and nice greetings from Tyrol!
John Mulcahy
REW Author
- Joined
- Apr 3, 2017
- Posts
- 9,388
I'm from the UK, Horst. All waterfall data is calculated from the impulse response, as is the case for most things including the SPL and phase plots. The impulse response reflects the behaviour of the system measured, so it is all as "real" as the measurement.
Alpi
Member
Thread Starter
- Joined
- Feb 21, 2018
- Posts
- 80
I'm from the UK, Horst.
Oh... sorry
")
Thanks for the explanation.
John Mulcahy
REW Author
- Joined
- Apr 3, 2017
- Posts
- 9,388
I don't understand your question, sorry, and there is nothing called DBA 1 or DBA 2 in that file.
Alpi
Member
Thread Starter
- Joined
- Feb 21, 2018
- Posts
- 80
Hi John,
Sorry for my incomplete question. The last two measurements.
Once just that inverted the back array without delay (DBA 2) and once the back array inverted and a delay of 15.5ms (~ space length) - DBA 1.
Crossover = 100Hz
Which is the better measurement or which setting do you find better?
Kind regards
Attachments
John Mulcahy
REW Author
- Joined
- Apr 3, 2017
- Posts
- 9,388
DBA 2 looks better to me at that measurement position, but to evaluate how successful a DBA is you should measure at all the positions of interest.


Popular tags
20th century fox
4k blu-ray
4k uhd
4k ultrahd
action
adventure
animated
animation
bass
blu-ray
calibration
comedy
comics
denon
dirac
dirac live
disney
dolby atmos
drama
fantasy
hdmi 2.1
home theater
horror
kaleidescape
klipsch
lionsgate
marantz
movies
onkyo
paramount
pioneer
rew
romance
sci-fi
scream factory
shout factory
sony
stormaudio
subwoofer
svs
terror
thriller
uhd
ultrahd
ultrahd 4k
universal
value electronics
warner
warner brothers
well go usa