Explain what trace Arithmetic is doing

Matthew J Poes

AV Addict
Thread Starter
Joined
Oct 18, 2017
Posts
1,904
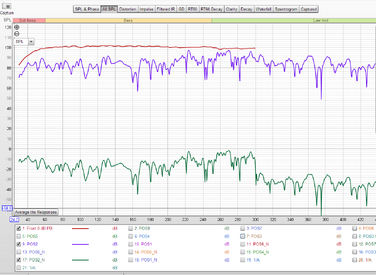
hey John could you explain a bit about exactly what the different trace arithmetic is doing?

When I divided the same measurement into itself I expected to see a flat line at 1, but didn't get that. Either I'm a dummy and just didn't click the right buttons or it doesn't work as I thought it would.

We talked before about taking two time aligned measurements with and without absorption and dividing one into the other. I would expect this to give me a ratio of absorbed to unabsorbed energy in the reflection.

I want to make sure I know how to interpret these but I'm not sure I have quite wrapped my head around this yet. I'm sure once you explain it, it will make sense. I think I get that adding or subtracting two measurements is akin to adding or subtracting a sound source. Right?
 
Measurement divided by itself should give a flat line at 0 dB. Multiplication is cascading transfer functions, so a filter response times a measurement gives the filtered result. Summation is indeed akin to adding sound sources.
 
So division of the original and filtered response gives me the filter, correct? That means a no absorption reflection divided by an absorbed reflection gives me the "filter" shape of the absorber, hence your recommendation. Do I have that right now?
 
More or less, I would divide the absorber measurement by the no absorber measurement to see the effect of the absorber -> filtered/original = filter transfer function.
 
Dear John: With trace arithmetic, I normally use addition or subtraction of decibel values to yield the difference or sum or two responses with a decibel result. But your division operation yields the result that I would expect to get with decibel subtraction, so I assume you must be dividing the two linear values to get the ratio and then displaying the result in log (decibels). Would that be correct?

I think it would be easier at least for me to understand trace arithmetic if you would say "arithmetic decibel addition" or "arithmetic decibel subtraction" since the linear values are never displayed and would confuse the user anyway.

Can you please give an example where someone would want to perform A minus B or A plus B trace arithmetic on the traces which are displayed in decibels already?

I don't personally have a use case for this, but from what John said, it was my impression that addition and subtraction acts like the addition and subtraction of a sound source.
 
All trace arithmetic is done on the linearly scaled values, with conversion back to dB afterwards. Multiplication is analogous to cascading transfer functions - for example, multiplying a drive unit measurement by a filter response will show how the response would look with the filter applied. Addition is analogous to combining sources, as Matthew notes - for example adding response measurements from a sub and a main speaker to see the combined result.
 
Aha.... that's useful. Let's say that I want to splice and mathematically cross over two full range responses. Don't ask why, just to be hypothetical. For example, response 1 goes from 10 Hz to 24 kHz and so does response #2. But I want to add the portion of response 1 that goes up to 100 Hz with a portion of response #2 that goes from 100 Hz on up.

I could laboriously a "fake crossover curve" in Excel that I could turn into a text file and use it to split up each of the two measurements by trace arithmetic and then combine the splits into a single measurement. Is there a less laborious way of doing that completely within REW? For example, if we could create a filter in the EQ section and export that as an impulse response or export a filter to a frequency response text file we could use that filter to mathematically transform a measurement. Maybe there's a direct way to do that already in REW that I haven't discovered?
 
For example, in the EQ section there's an "export filter settings to text".... Instead would it be possible to read biquad coefficients and convert them to a measurement? I know that's math... and not intuitively easy, but if anyone can do it, John???
 
Wouldn't the merge function make more sense if you wanted to take to measurements like that and combine them?

I think the difference here is that merging is just for combining two measurements split at a particular point. Say the bass frequencies of measurement 1 below 200hz and the midbass to high frequencies of measurement 2 from 200hz on up. In this scenario there combined acoustic output and phase isn't really an issue.

If you added a subwoofer to a full range main speaker measurement using the adding function you also get the effect it would have given the phase relationship at the integration point and the effect of the natural overlap. If you wanted to measure a midbass and tweeter and then apply fake crossovers to them to see how it works as a speaker I can see doing what you say, but then, why not just use the many crossover design software for that, as it would be the same thing (and you could at least adjust the crossover in that software).

You could upload a transfer function response of the crossover and multiply that times the intended measurement. Then add that to the other measurement. This gives the effect of adding the crossed over measurement.

I haven't found a good use for adding and subtracting as of yet, but since John helped me understand how this works, division and multiplication have become my new best friend.
 
The Trace Arithmetic Merge is the easiest way to do what you describe, Bob, just pick the merge frequency.

As an example of using addition, taking individual measurements of each speaker and sub in a system while using a timing reference allows combined responses, e.g. Subs and mains or left and right to be generated using trace arithmetic rather than remeasuring while driving the various combinations.
 
Are there any guides for trace arithmetic I want to see what a Sub curve added to a channel with sub turned off should look like, I assume this would not correct for phase, ie its simply adding them ? Or does it look at the timings and include that in the calc ?
 
Hmmm, so I think that adding A+B will add the traces of say A, the sub without the main, B the main without the sub and bring them together in exactly the same way as played together, including any phase alignment issues ?

Is there a way of adding without including any phase integration challenges so a target curve can be seen if phase is correct at the cover point ?
 
If you generate the RMS average and add 3 dB that would be close, but you could just look at the phase traces to see if they are the same through that region.
 
John, tks, How do I add 3 db to the RMS average ? Sorry I found it in measurement actions
 
Maybe this is a good place to dump my can of worms! I have tried using the A/B several times recently. In most of these instances, I wanted to divide out a near field measurement from an in-room measurement, to normalize and remove the effect of the source. I seem to get very erratic results.

Here is an example. I had 8 measurements made at different locations in the room. For 7 of these measurements, I got what I expected. The rolloff of the source was removed from the magnitude response of the in-room measurement. At this point, I don't really care about the phase response. BUT, for measurement #3 I get a wonky response. I have looked at these measurements in every way I can think of and I don't see ANY reason why measurement #3 division does not work. In terms of phase response, it is pretty much smack dab right between #2 and #4. All measurements were made within a few minutes of each other. No sampling rate changes or other funny business between the in-room measurements. Here is result for A/B for measurement #2, typical for all measurements except #3:
38087


Now, here is for #3, the odd one:

38088


But, #3 is not different than the others in any way I can find. For example:
38092


and...

38093


I'd like to figure out what happened here. I know it gets more complicated when the phases are included. One can get acausal impulse responses, maybe divide by zero issues. But for now I'd be happy with a simple magnitude response. I did try some things like aligning the impulses, but with only mixed (and confusing) results. One issue is, when you align multiple traces, does that modify the underlaying (original) data? Or is just for visualizing? If nothing else, what is the best method to simply divide magnitudes of 2 measurements?
 

Attachments

  • 1609191957697.png
    1609191957697.png
    49.8 KB · Views: 22
Maybe this is a good place to dump my can of worms! I have tried using the A/B several times recently. In most of these instances, I wanted to divide out a near field measurement from an in-room measurement, to normalize and remove the effect of the source. I seem to get very erratic results.

Here is an example. I had 8 measurements made at different locations in the room. For 7 of these measurements, I got what I expected. The rolloff of the source was removed from the magnitude response of the in-room measurement. At this point, I don't really care about the phase response. BUT, for measurement #3 I get a wonky response. I have looked at these measurements in every way I can think of and I don't see ANY reason why measurement #3 division does not work. In terms of phase response, it is pretty much smack dab right between #2 and #4. All measurements were made within a few minutes of each other. No sampling rate changes or other funny business between the in-room measurements. Here is result for A/B for measurement #2, typical for all measurements except #3:View attachment 38087

Now, here is for #3, the odd one:

View attachment 38088

But, #3 is not different than the others in any way I can find. For example:
View attachment 38092

and...

View attachment 38093


I'd like to figure out what happened here. I know it gets more complicated when the phases are included. One can get acausal impulse responses, maybe divide by zero issues. But for now I'd be happy with a simple magnitude response. I did try some things like aligning the impulses, but with only mixed (and confusing) results. One issue is, when you align multiple traces, does that modify the underlaying (original) data? Or is just for visualizing? If nothing else, what is the best method to simply divide magnitudes of 2 measurements?
and the file attached...
 

Attachments

REW placed the window setting wrong in the calculated result.
Reset the left, right and Reference window settings back to the default of 125/500/0 or something that spans the calculated impulse response properly.
 
That IS weird! I made those A/B trace arithmetic plots all at the same time, one after the other. The windows for the source measurements are all the same. I wonder how the heck that window got goobered up then? It looks like maybe in that particular A/B, the artifact that shows up outside the expected window:
38095

In just that particular case was large enough to cause REW to center the window over it. I'm thinking this is due to the nearfield measurement going only up to 300 Hz, whereas the other measruements are going up to 1 kHz. Maybe that causes an artifact? In fact if you look at the 2 curved and the A/B, it is interesting. At 300 Hz, where A/B isn't really defined, REW still give a result:

38096


The result drops 20 dB but otherwise looks like the "A" in the A/B. I wonder if John is using a small regularization factor in the denominator (to reduce divide by near zero effects) that gives this result. Otherwise, I can't figure out where the response above 300 Hz comes from. Also, so does it mean that REW is doing all calculations in time domain and only at the end converting to freq domain (via the aforementioned windows)? I guess the combination of that and the automatic selection of windows could lead to issues such as this.
 
Maybe this is a good place to dump my can of worms
if you are Todd Welti then I believe your worms would be welcome here probably
 
That IS weird! I made those A/B trace arithmetic plots all at the same time, one after the other. The windows for the source measurements are all the same. I wonder how the heck that window got goobered up then?
The peak of the result IR was outside the range and got chosen as the ref. The large artefacts outside the valid part of the result are caused by starting the measurements at a relatively high frequency (30 Hz) and ending the ref measurement at a very low frequency (300 Hz) that is also much lower than the span of the other measurements. Here is the relevant help section on how REW handles that:

The frequency span of the result of an arithmetic operation will be from the lowest start frequency to the highest end frequency of the traces operated on. Outside their frequency range traces are treated as being zero valued, with the exception of the divisor in a division operation which is treated as being unity outside its range. If the measurements actually have significant levels outside the measurement range the zero setting will generate oscillations in frequency and time domains, for best results use traces that span the full frequency range.

I'd suggest starting the measurements at zero and ending both reference and actual at the same frequency.
 
Back
Top