Thread Starter
- Joined
- Mar 12, 2023
- Messages
- 45
Hi, please find below the measurements of UMIK-1 vs iMM-6.
Configuration is as below.
AVR - Denon x4700h
Speaker - Polk ES-15 (L+R used for measurement)
Sub - SVS SB 3000
Only the challenge I faced was in Impulse measurement. It is not working as expected.
It does not measure the correct impulse with the use of acoustic time reference. I use it for speaker time alignment. Can anyone share their experience and guide how to measure the correct impulse with iMM-6?
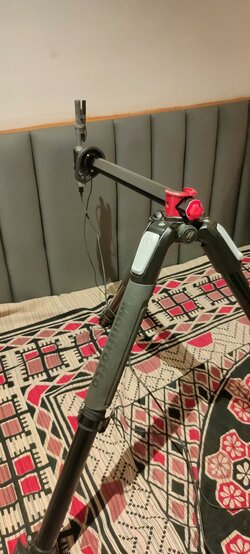
Mic set-up as below.

I have connected iMM-6 with a USB audio driver and selected "USB PnP Sound Device" as input in REW.

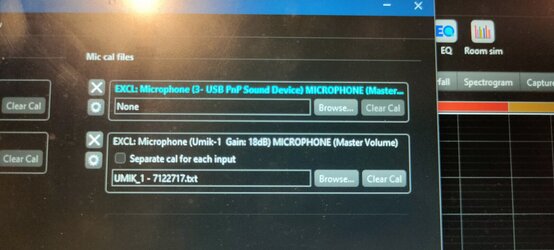
I have used two different calibration files for iMM-6. One was the original file downloaded from the Dayton website and the Second one was the UMIK-1 file.
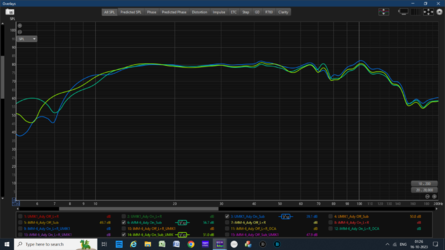
Sub-calibration data:

Blue: UMIK-1 with factory calibrated file
Green: iMM-6 with factory calibrated file
Yellow: iMM-6 with UMIK-1 calibration file
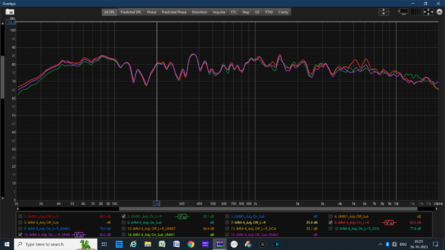
Speaker Calibration data (without sub):
Green: UMIK-1 with factory calibrated file
Red: iMM-6 with factory calibrated file
Purple: iMM-6 with UMIK-1 calibration file
I found that iMM-6 can measure below 10hz and comparing the price, it is a worthy investment. Differences are much acceptable considering the price to performance.
Configuration is as below.
AVR - Denon x4700h
Speaker - Polk ES-15 (L+R used for measurement)
Sub - SVS SB 3000
Only the challenge I faced was in Impulse measurement. It is not working as expected.
It does not measure the correct impulse with the use of acoustic time reference. I use it for speaker time alignment. Can anyone share their experience and guide how to measure the correct impulse with iMM-6?
Mic set-up as below.
I have connected iMM-6 with a USB audio driver and selected "USB PnP Sound Device" as input in REW.
I have used two different calibration files for iMM-6. One was the original file downloaded from the Dayton website and the Second one was the UMIK-1 file.
Sub-calibration data:
Blue: UMIK-1 with factory calibrated file
Green: iMM-6 with factory calibrated file
Yellow: iMM-6 with UMIK-1 calibration file
Speaker Calibration data (without sub):
Green: UMIK-1 with factory calibrated file
Red: iMM-6 with factory calibrated file
Purple: iMM-6 with UMIK-1 calibration file
I found that iMM-6 can measure below 10hz and comparing the price, it is a worthy investment. Differences are much acceptable considering the price to performance.