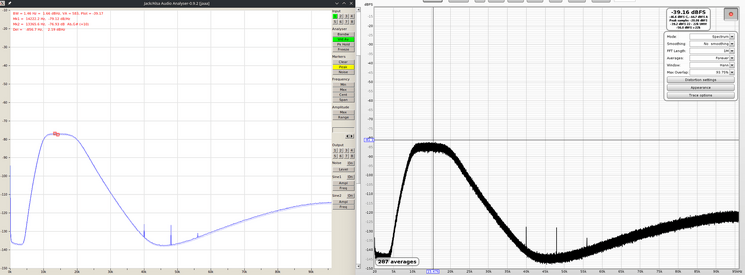
Correct Noise Density Level measurements

Quater

Registered
Thread Starter
Joined
Nov 22, 2021
Messages
7
Hello,
First of all thanks a lot for this awesome software tool!

How to make absolute "noise density" measurements of uncorrelated noise in REW?

1637616208310.png

In the Jaaa "doku" i found.
/kokkinizita.linuxaudio.org/papers/jaaa-pres
Correct signal level display requires peak value
Correct noise level display requires average value
JAAA displays two traces in this case.

If I change the FFT size of cause the noise floor changes
How can i see the "FFT gain" or the fft bucket with?

How can i see the true dB/Hz value independent from FFT size, and window?

I have seen that i can set the scale to V/√Hz. This is FFT size, and window independent i assume!?
What happens if i use this in the RTA mode?
47822
47823

The V/√Hz changes an order of magnitude by changing from FFT to RTA this can’t be right?!


This is maybe even a Feature request...
Can i set the scale to dBV/√Hz or dBFS/√Hz pleases.
 

John Mulcahy

REW Author
Joined
Apr 3, 2017
Messages
7,212
Per the help: There is also a volts per √Hz Y axis option to display the amplitude spectral density, this is only meaningful when using the spectrum view. The RTA views show summed energy within the chosen octave fraction.

There are already 9 Y axis choices on the RTA window, I'm reluctant to start doubling up by adding more /√Hz options for them. The graph plots the spectral density on a log scale so further axis options wouldn't seem to add much.
 

Quater

Registered
Thread Starter
Joined
Nov 22, 2021
Messages
7
There are already 9 Y axis choices on the RTA window, I'm reluctant to start doubling up by adding more /√Hz options for them. The graph plots the spectral density on a log scale so further axis options wouldn't seem to add much.
Thanks a lot for the replay!
If i save the measurement from the RTA with the "Save Current button" it appears in the main window where i can view it in dBFS but this measurement is no longer independent of the FFT length?
so can i only view it in the RTA window?
Is there a fixed "correction factor" so i can manually apply an offset?

My Goal is to have a sensitive long "True peak" FFT graph with lots of gain and Coherent averaging and and a separate graph to show the "true" Noise floor in √Hz with (magnitude?) averaging and without the fft gain.
I would like to be able to overlay them in the same system both in dB(FS). from there i can apply a calibration factor to them to get to dBV or dBSPL.


Most likely i'm not understanding it Please excuse me if im appearing ignorant or stupid. i'm tiring to Learn (and REW is powerful and awesome tool to experiment and learn)
butt isn't the √Hz option on the Y axis doing something fundamentally different to the other options?
Most other options (in dB) to my understanding just add an Offset/calibration factor. and shift everything up or down?
While √Hz dose something diffrent to keep true peak and true noise floor at the same time? seems like this would require scaling graph in the y axis as compared to shifting.

Is my understanding correct and can you point to some documentation for me to get better understanding?

In this case my proposal would be to make √Hz a separate option so all the 8 Y axis choices can be combined with the √Hz option
 
Last edited:

John Mulcahy

REW Author
Joined
Apr 3, 2017
Messages
7,212
I'm losing track of what the question is here. In spectrum mode the noise density plot is independent of FFT length and window selection. If you change to a fractional octave RTA mode it isn't, but I have no idea why you would use a fractional octave RTA mode for that measurement. Perhaps you could list your questions and separate them from general commentary.
 

Quater

Registered
Thread Starter
Joined
Nov 22, 2021
Messages
7
In spectrum mode the noise density plot is independent of FFT length and window selection.
Thanks. this is what i want.
How can i capture this measurement?

If you change to a fractional octave RTA mode it isn't, but I have no idea why you would use a fractional
I don't want this. i was just noticing i can do this and was wondering why.

Export
Perhaps you could list your questions and separate them from general commentary.
Sorry, I try to do a Better job expressing my Questions.


I want to Export this measurement:
47825


Here i can read of about 7-8µV√Hz @1khz independent of FFT length and window selection.

But if i export/save this data. i can no longer see V√Hz but only V and i it is no longer the same 7-8µV as measured before.
47826
 

John Mulcahy

REW Author
Joined
Apr 3, 2017
Messages
7,212
There isn't a V/√Hz axis option on any graph other than the RTA window. I can look at adding one in a future build, in the meantime the first trace on the RTA window is the currently selected measurement so it is possible to compare the current spectrum with some previously saved measurement there.
 

Quater

Registered
Thread Starter
Joined
Nov 22, 2021
Messages
7
There isn't a V/√Hz axis option on any graph other than the RTA window
Ok i understand

I can look at adding one in a future build,
I would highly appropriate this!

in the meantime the first trace on the RTA window is the currently selected measurement so it is possible to compare the current spectrum with some previously saved measurement there.
Thanks for the tip!

This might be related:
NSD has been used for many years as a performance parameter on the front page of many ADC data sheets. You may have noticed that it is a relatively large negative number defined in either dBFS/Hz or dBm/Hz. A typical range that may be observed on a data sheet for an ADC’s NSD could be anywhere from –140 dBFS/Hz to –165 dBFS/Hz.
analog.com/en/technical-articles/use-noise-spectral-density-to-evaluate-adcs-in-software-defined-systems.html

kluedo.ub.uni-kl.de/frontdoor/deliver/index/docId/4293/file/exact_fft_measurements.pdf
 

Quater

Registered
Thread Starter
Joined
Nov 22, 2021
Messages
7
48142

48144

48145

48146


Can i uses this formula to calculate the RMS noise?
Do i have to apply window scaling factor?

dose REW automatically apply "window scaling factor" if i uses V/√Hz?
 

John Mulcahy

REW Author
Joined
Apr 3, 2017
Messages
7,212
REW takes window noise bandwidth into account, it would be a bit useless if it didn't. If you want rms levels just read them off the RTA levels window, the figures are calculated for the range between the LP and HP filter frequencies.
 

Quater

Registered
Thread Starter
Joined
Nov 22, 2021
Messages
7
Thanks.
If i get this right i can use the formula (√(Sample rate/FFT size)) this gives me a scaling factor to go from V to V/√Hz.
There is no V/√Hz. Option in the All SPL tab and im trying to work around this.
 

John Mulcahy

REW Author
Joined
Apr 3, 2017
Messages
7,212
Yes, though you need to scale by window noise bandwidth when converting frequency responses so the dB offset is 10*log10(sampleRate*noiseBW/fftLength).
 
Top Bottom