John Mulcahy
REW Author
Thread Starter
- Joined
- Apr 3, 2017
- Posts
- 9,064
Measure dialog
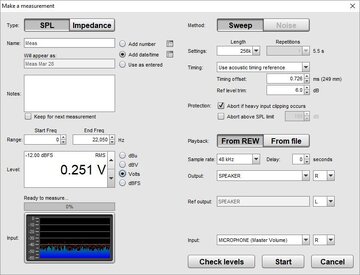
I've redesigned the Measure dialog for this version, with options to enter the measurement name and notes on the dialog and a few options for appending a date, time or number to the measurement name. Broadly speaking, things that may be changed often are on the left of the dialog, things that are changed less often on the right. There is a live display of the input level on the measurement input at the bottom of the dialog.

Hopefully the layout is now more logical. The new design provides better support for measuring using file playback. It also provides the ability to change the sample rate from the Measure dialog.
There are a couple of changes relating to timing in the new design. The "Wait for timing ref" option has been removed, if the acoustic timing reference is being used REW will always wait for the timing ref signal. An option has been added to apply a timing offset measurements made with a timing reference. The offset can be set manually or automatically from the figure calculated by Estimate IR Delay. It would typically be used after an initial measurement has been made and the desired offset for subsequent measurements determined from that. A warning is shown if the timing reference signal level is low, if the level is too low timing will not be accurate, the timing reference may not be detected or the measurement sweep may be incorrectly identified as the timing reference.
As before, to quickly start a measurement use <Ctrl>+M to bring up the dialog and press the space bar.
Making measurements help
Scope tool
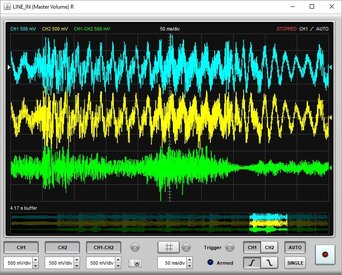
Another new item in this release is an oscilloscope tool, with 2 input channels (the measurement and reference inputs) and a math channel (sum, difference, product or ratio of the inputs). It operates in pretty much the same way as a hardware scope, with basic trigger options (rising or falling edge with adjustable hysteresis). There are settings menus (the gear icons) but the trigger position, level, hysteresis and channel offsets can all be adjusted by clicking and dragging on their symbols on the screen (the mousewheel adjusts trigger hysteresis when the trigger level symbol is selected). The mousewheel can be used to change the timebase when the mouse cursor is in the display area and a stopped trace can be moved by clicking and dragging on the display or clicking and dragging on the highlighted portion of the input buffer view below the display.

Scope help
Signal Generator
There have been a few updates for the signal generator. White random noise has been added to the noise options and the order of the high pass and low pass filters for the custom filtered noise can now be configured from 2nd to 8th order (12 to 48 dB/octave). The generator now also remembers the states of the custom filtered noise check boxes for the next startup. There is an option to specify the toneburst duration in ms rather than cycles. Finally, the level control shows the peak level as well as RMS.
RTA
There are a few minor tweaks for the RTA. 0% has been added as an option for the RTA max overlap to allow no overlap when beneficial (such as when measuring with rectangular windows). There is also a separate max overlap control for stepped sine measurements, lower overlap increases the noise reduction from averaging. A volts per sqrt(Hz) Y axis option has been added to display the amplitude spectral density, useful for noise measurements. The width of the RTA control buttons has also been reduced so it is useable at widths down to 800 pixels.
Other updates include:
Bug fixes in this release:
Quite a few changes all in all. If anything isn't behaving as expected let me know here.
I've redesigned the Measure dialog for this version, with options to enter the measurement name and notes on the dialog and a few options for appending a date, time or number to the measurement name. Broadly speaking, things that may be changed often are on the left of the dialog, things that are changed less often on the right. There is a live display of the input level on the measurement input at the bottom of the dialog.

Hopefully the layout is now more logical. The new design provides better support for measuring using file playback. It also provides the ability to change the sample rate from the Measure dialog.
There are a couple of changes relating to timing in the new design. The "Wait for timing ref" option has been removed, if the acoustic timing reference is being used REW will always wait for the timing ref signal. An option has been added to apply a timing offset measurements made with a timing reference. The offset can be set manually or automatically from the figure calculated by Estimate IR Delay. It would typically be used after an initial measurement has been made and the desired offset for subsequent measurements determined from that. A warning is shown if the timing reference signal level is low, if the level is too low timing will not be accurate, the timing reference may not be detected or the measurement sweep may be incorrectly identified as the timing reference.
As before, to quickly start a measurement use <Ctrl>+M to bring up the dialog and press the space bar.
Making measurements help
Scope tool
Another new item in this release is an oscilloscope tool, with 2 input channels (the measurement and reference inputs) and a math channel (sum, difference, product or ratio of the inputs). It operates in pretty much the same way as a hardware scope, with basic trigger options (rising or falling edge with adjustable hysteresis). There are settings menus (the gear icons) but the trigger position, level, hysteresis and channel offsets can all be adjusted by clicking and dragging on their symbols on the screen (the mousewheel adjusts trigger hysteresis when the trigger level symbol is selected). The mousewheel can be used to change the timebase when the mouse cursor is in the display area and a stopped trace can be moved by clicking and dragging on the display or clicking and dragging on the highlighted portion of the input buffer view below the display.

Scope help
Signal Generator
There have been a few updates for the signal generator. White random noise has been added to the noise options and the order of the high pass and low pass filters for the custom filtered noise can now be configured from 2nd to 8th order (12 to 48 dB/octave). The generator now also remembers the states of the custom filtered noise check boxes for the next startup. There is an option to specify the toneburst duration in ms rather than cycles. Finally, the level control shows the peak level as well as RMS.
RTA
There are a few minor tweaks for the RTA. 0% has been added as an option for the RTA max overlap to allow no overlap when beneficial (such as when measuring with rectangular windows). There is also a separate max overlap control for stepped sine measurements, lower overlap increases the noise reduction from averaging. A volts per sqrt(Hz) Y axis option has been added to display the amplitude spectral density, useful for noise measurements. The width of the RTA control buttons has also been reduced so it is useable at widths down to 800 pixels.
Other updates include:
- Added a "Set t=0 at cursor" control to the impulse overlay graph, which applies to all the measurements selected when it is used
- Added an equaliser setting for the miniDSP C-DSP 8x12 with 10 filters at 192 kHz sample rate
- The RT60 calculation has been made much faster
- Loading measurement files has been made faster
- Multiple sample rates can be selected when exporting filter impulse responses
- A dB axis is not shown on the Overlay Measured or All Impedance graphs when only impedance measurements are loaded
- Installers for all OS types now have an option to choose how much memory to allocate to REW when it runs, max 1.5 GB on 32-bit versions. Best going for the max value as long as the computer has at least 4 GB RAM.
- The gradient panel background image is drawn even wider than before in another attempt to remove duff columns of pixels at RHS of window on macOS
Bug fixes in this release:
- macOS windows that were maximised then iconified before exit would open with zero size on the next startup
- The generator dBV offset was incorrect when the option for full scale sine is 0 dBFS was not selected
- Periodic noise crest factor optimisation was not operating correctly so the crest factor could be higher than the 6 dB target
- ASIO outputs did not stop correctly with ASIO buffer sizes of 8192 samples or larger
- Text in the new version notification was too light to read when using the dark background option
- The signal generator output was present on both the measurement and timing ref outputs for all signal types when the timing ref mode was loopback, should only be the case for measurement sweeps
Quite a few changes all in all. If anything isn't behaving as expected let me know here.


