Can't unwrap phase display

JLM1948

Member
Thread Starter
Joined
Jan 12, 2019
Messages
124
I'm working on a 4-pole All-Pass filter, for which I want to display phase continuously.
I tried to usz "Fit to data", but apparently it didn't do what I wanted, so I tried forcing manually the limits, which doesn't work either.
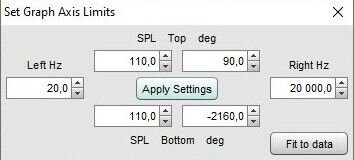
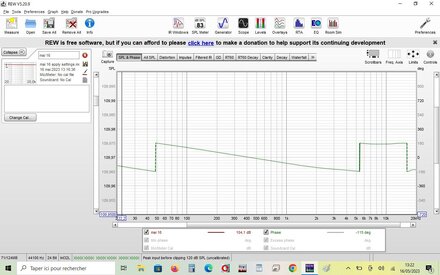
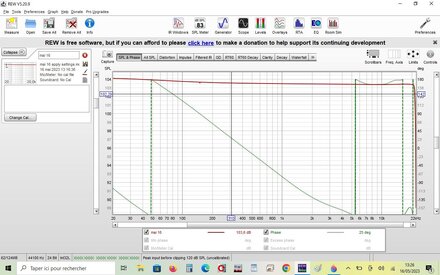
Please find attached the measurement data files, the limits dialog and the resulting graphs.
 

Attachments

  • limits .jpg
    limits .jpg
    10.9 KB · Views: 2
  • mai 16 apply settings.jpg
    mai 16 apply settings.jpg
    155 KB · Views: 4
  • mai 16 apply settings.mdat
    1.6 MB · Views: 4
  • Mai 16 fit to data.jpg
    Mai 16 fit to data.jpg
    155.5 KB · Views: 4
  • mai 16 fit to data.mdat
    1.6 MB · Views: 5

JLM1948

Member
Thread Starter
Joined
Jan 12, 2019
Messages
124
OK, got it.
It works on my bench . I don't suppose there's a possibility to produce a graph of the phase delta vs. fequency...? Not terribly important anyway. Thanks for your help.
 
Last edited:

John Mulcahy

REW Author
Joined
Apr 3, 2017
Messages
7,357
Did you mean phase delay? No, there isn't a graph of phase delay, it doesn't seem very useful, to me at least.
 
Top Bottom