


-
AUDIO VIDEO PROCESSING, SETUP & ENVIRONMENTOfficial REW (Room EQ Wizard) Support Forum Audiolense User Forum Calibration Equipment Auto-EQ Platforms / Immersive Audio Codecs Video Display Technologies / Calibration AV System Setup and Support Listening Room / Home Theater Build Projects Room Acoustics and Treatments AV Showcase Movies / Music / TV / Streaming
-
AUDIO VIDEO DISCUSSION / EQUIPMENTHome Theater / Audio and Video - Misc Topics Essence For Hi Res Audio AV Equipment Advice and Pricing Awesome Deals and Budget AV Equipment AV Receivers / Processors / Amps UHD / Blu-ray / CD Players / Streaming Devices Two Channel Hi-Fi Equipment DIY Audio Projects Computer Systems - HTPC / Gaming HD and UHD Flat Screen Displays Projectors and Projection Screens AV Accessories Buy - Sell - Trade
Navigation
Install the app
How to install the app on iOS
Follow along with the video below to see how to install our site as a web app on your home screen.
Note: This feature may not be available in some browsers.
More options
You are using an out of date browser. It may not display this or other websites correctly.
You should upgrade or use an alternative browser.
You should upgrade or use an alternative browser.
"All Phase"
- Thread starter bobolix
- Start date

John Mulcahy
REW Author
- Joined
- Apr 3, 2017
- Posts
- 9,393
Vector average includes phase. The Phase Overlay graph shows all phase responses.
 REW rulez !
bobolix
Registered
Thread Starter
- Joined
- Feb 11, 2018
- Posts
- 32
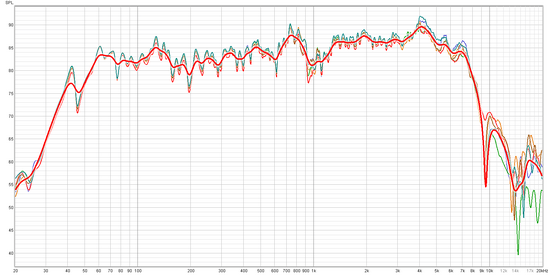
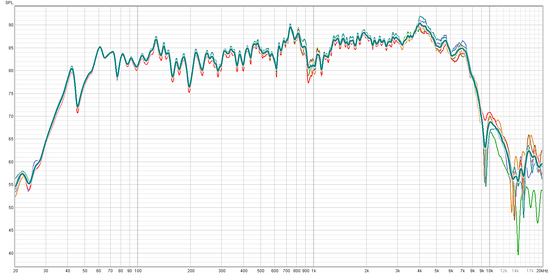
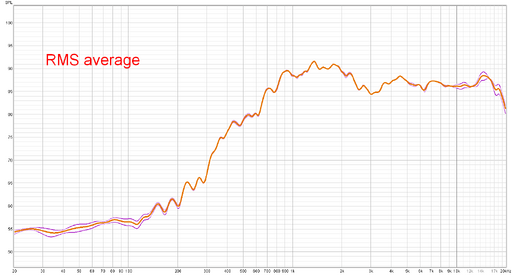
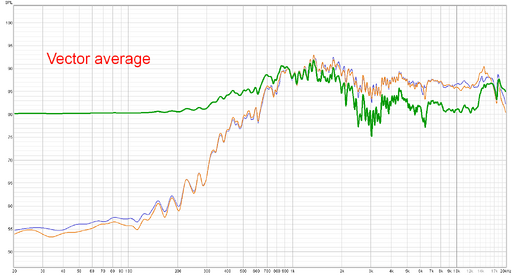
I have another problem with the averaging. Attached are two pictures related to two tweeters averaging, the first beeing created by RMS avg, the second by vector avg. There must be something wrong with the vector averaging definitely, but absolutely I can't get what. Both graphs were creates under the same conditions as these in the my previous comments, which have been related to six woofers.
Attachments
John Mulcahy
REW Author
- Joined
- Apr 3, 2017
- Posts
- 9,393
Images aren't very useful for investigation, please attach the measurements.
John Mulcahy
REW Author
- Joined
- Apr 3, 2017
- Posts
- 9,393
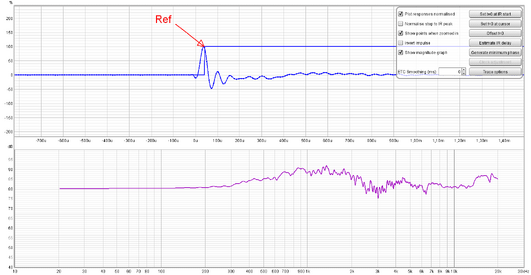
The problem with your tweeter measurements is you set the left window to zero. Why did you do that? Here they are with 1 ms left window (or you could just set some suitably non-zero left window width on the result).

There is no smoothing in vector averaging, though the averaging may reduce random variations.

There is no smoothing in vector averaging, though the averaging may reduce random variations.

 . Now I'm really confused.
  .
.John Mulcahy
REW Author
- Joined
- Apr 3, 2017
- Posts
- 9,393
I am now also confused, did you read my reply? There is nothing wrong with the vector average of those tweeter measurements, the only problem is your window choices.
bobolix
Registered
Thread Starter
- Joined
- Feb 11, 2018
- Posts
- 32
Concerning the left window zero - it was not set in fact. At the original measurements there was the Left window zero without problems and it was left for averaging, too. (Usually I adapt the left window so that the correct phase response were achieved - a problem with the noise or so.) The matter of fact is that if the vector average is made, then the reference point (Window Ref Time) is automatically set to the peak sample of the resulting impulse response (0.038 ms in the examined case), and if the Left Window is set to zero, then the result is wrong, because a part of the impulse is lost for the frequency response calculation. If the Ref Time is set to zero manually, then all is O.K. even if the Left window is zero still.
Now it is all clear for me, but I think it would be better maybe if the Window Ref Time was not changed at the vector averaging. However there could exist another problem perhaps, what Ref Time should be used if these for different original responses were different. It seems at the existing state the first peak sample is chosen.
Now it is all clear for me, but I think it would be better maybe if the Window Ref Time was not changed at the vector averaging. However there could exist another problem perhaps, what Ref Time should be used if these for different original responses were different. It seems at the existing state the first peak sample is chosen.
Attachments
John Mulcahy
REW Author
- Joined
- Apr 3, 2017
- Posts
- 9,393
Trace Arithmetic operations are done in the frequency domain using data obtained from applying the windows that have been set for the responses.


Popular tags
20th century fox
4k blu-ray
4k uhd
4k ultrahd
action
adventure
animated
animation
bass
blu-ray
calibration
comedy
comics
denon
dirac
dirac live
disney
dolby atmos
drama
fantasy
hdmi 2.1
home theater
horror
kaleidescape
klipsch
lionsgate
marantz
movies
onkyo
paramount
pioneer
rew
romance
sci-fi
scream factory
shout factory
sony
stormaudio
subwoofer
svs
terror
thriller
uhd
ultrahd
ultrahd 4k
universal
value electronics
warner
warner brothers
well go usa