Yup the C Filter is a curve which represents how the ear hears at quite a high level, say over 85dB. The A filter does the same but way down around 40dB where we are really very deaf to LF.
More formally. https://www.engineeringtoolbox.com/decibel-d_59.html
Yup the C Filter is a curve which represents how the ear hears at quite a high level, say 85dB. The A filter does the same but way down around 40dB where we are really quite deaf to LF.
thanks for the quick response. Is this what is referred to as C-weighting and A-weighting when talking about spl meters? also, is the big number up top the peak spl measurement?
You are welcome. Indeed they are. dBC and the like are defined scientific terms wherever they occur. Peak SPL is also a defined term, and there are many others, e.g. LAFmax! Check the REW manual to see what that changing number means. I suspect it is Lp, i.e. Sound Pressure Level averaged over the last Second if Slow weighting is used. Similar to the changing number you would see on the SPL Meter, but with Zero or no frequency weighing.
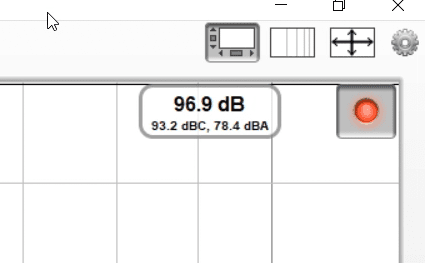
The current Input RMS value is shown to the left of the record button, in dB SPL or dBFS according to the setting of the Y axis. This figure excludes any DC content in the signal. A and C weighted values are shown below the unweighted rms figure. If clipping is detected in the input the RMS value turns red.
So if i'm analyzing a scene from a movie for instance, the unweighted rms number tells me an average over the last second like DanDan mentioned? is this an average throughout the entire frequency range or only the range that i have set in the RTA window?
This site uses cookies to help personalise content, tailor your experience and to keep you logged in if you register.
By continuing to use this site, you are consenting to our use of cookies.