xenofon
Registered
Thread Starter
- Joined
- Dec 17, 2017
- Posts
- 3
Hi,
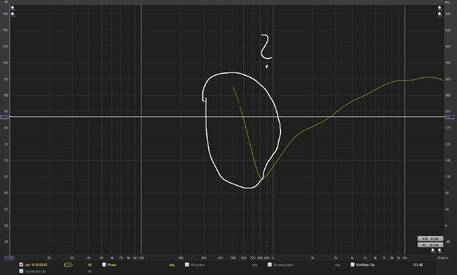
why do i see this strange beginning of the curve. I checked all input and outputdevices to be correct. Windows and ASUS Xonar drivers seem ok too. I have tried 2 different soundcards.
Its a 500-20.000Hz sweep on a tweeter with a 6dB highpass filter. Same if i measure 10-20.000Hz - This hook at the beginning is always showing.
My guess is a latency or buffer issue in the first second of measurement.
Attachments
Last edited:

")