Waterfall zoom

xappn

New Member
Thread Starter
Joined
Jan 27, 2022
Messages
5
Hello,

I was looking for a forum to post my control room measurements for evaluation and interpretation, I hope this is a right place.


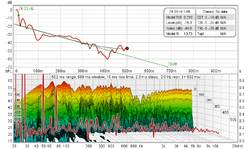
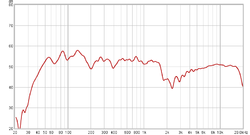
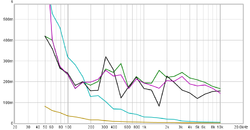
Do these graphs look fine to you? What would you suggest? The room is sounding ok to my ears but I'm always looking for something better (I don't like it but I can't help it).

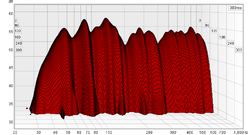
Is that dip starting at ~1.8kHz a room mode or just a little too much absorption?

I tried subtractive EQ generated by REW for Equalizer APO and for my DAW, but I didn't feel it was helping me a whole lot. Things got clearer but I felt like I lost some punch in low mids. I feel like I'd rather have the punch than remove the mud. Can you have both or is it always a compromise?


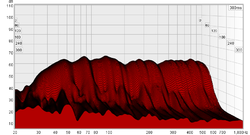
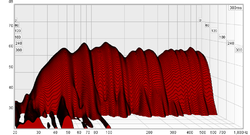
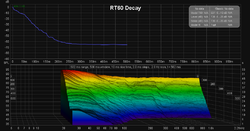
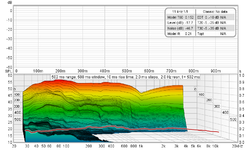
Lastly, I'm having a big time trouble interpreting the waterfall graph, so I included 3 screenshots of different levels of zoom. I can't seem to figure out what zoom level to use, because when I zoom away, the waterfall starts to look nicer, and when I zoom in it doesn't fit the screen anymore.


It's a long read but I hope someone could help me out! Thanks a lot!
 

Attachments

  • 27 01 2022 all spl 1_12 smoothing.png
    27 01 2022 all spl 1_12 smoothing.png
    7.6 KB · Views: 44
  • 27 01 2022 waterfall 1_12 smoothing (1).png
    27 01 2022 waterfall 1_12 smoothing (1).png
    52.8 KB · Views: 41
  • 27 01 2022 waterfall 1_12 smoothing (2).png
    27 01 2022 waterfall 1_12 smoothing (2).png
    55.8 KB · Views: 34
  • 27 01 2022 waterfall 1_12 smoothing (3).png
    27 01 2022 waterfall 1_12 smoothing (3).png
    63.4 KB · Views: 36
Last edited:

John Mulcahy

REW Author
Joined
Apr 3, 2017
Messages
7,348
Looks pretty good. The dip around 2 kHz is too high to be a modal feature. Might be a characteristic of the monitors. The Gearspace forum is a good spot for feedback on control rooms, lot of pro users there.
 

xappn

New Member
Thread Starter
Joined
Jan 27, 2022
Messages
5
Thanks for the reply! I will definitely check out the other forum, and also measure the frequency response of the monitors outdoors.


In the meantime, I'm sorry to bother, but could you assist me interpreting the waterfall graph? I understand that the top of the figure is frequency, and the slopes portray the decay of the frequency.

I see people saying that in this size of rooms, you would probably want your decay somewhere between 100-300ms. But would that be 100-300ms decay from the top to the noise floor or by a certain dB before the noise floor? You can tell I'm "a bit" lost.

Can you confirm me from the graphs, what decay time I'm dealing with in my room? Just so that I know what I'm looking.

Also, how steady decay across the spectrum would be considered good? I think I can tell from the graph that there are differences of several dozens of ms between frequencies. I assume that would affect the clarity, but how much difference is still "good"?

Thank you, it's highly appreciated!
 

John Mulcahy

REW Author
Joined
Apr 3, 2017
Messages
7,348
You'll get a better idea of decay times by looking at the RT60 graph. In small rooms the decay at frequencies below a couple of hundred Hz is dominated by modal resonances, the RT60 graph doesn't give meaningful results there. In the 200 Hz to 4 kHz span the ITU/EBU recommendation is to have the decay times fall within a +/- 50 ms range.
 

xappn

New Member
Thread Starter
Joined
Jan 27, 2022
Messages
5
Alright! Attached is the RT60 graph. When people are saying the decay of the frequencies should be somewhere around 100-300ms, are they generally talking about one of these coloured curves? Or should of them be in the range of 100-300ms (from a few hundred Hz upwards)?

From what I can tell all of the curves stay just within 100ms (I think that's equivalent of +/- 50ms? I feel stupid), except the black one, T20.


Is there a meaningful graph for low frequency decay?
 

Attachments

  • 27 01 2022 RT60.png
    27 01 2022 RT60.png
    14.6 KB · Views: 12

UKSPAWN

Member
Joined
Jun 18, 2021
Messages
69
Location
Nottingham, UK
More  
Preamp, Processor or Receiver
SMSL SU-9 (Pre/Dac)
Main Amp
Rotel A12 (Fixed output mode)
Computer Audio
PC via USB - Foobar2000
DAC
SMSL SU-9 (Pre/Dac)
Universal / Blu-ray / CD Player
Sony UBP-X800M2
Front Speakers
Monitor Audio Bronze 5g
Subwoofers
SVS SB1000PRO 12" + MonoPrice MONOLITH THX 10"
Other Speakers or Equipment
MINI DSP 2x4HD (L+R+SW1+SW2)
Video Display Device
BENQ W2000
Screen
EliteScreens AEON CineGrey 100"
Remote Control
SmartIR device via android
Streaming Equipment
(potentially) SMSL SD-9
Streaming Subscriptions
Tidal Masters, Spotify Free, Youtube...
Satellite System
What is TV?
Other Equipment
FiiO FH5s IEM + FiiO Q1 MKII DAC/AMP
i think there has been a confusion. Use the "RT60 DECAY" i think is what was intended to be said, as "RT60" isnt applicable to small rooms... is that right John?


"You'll get a better idea of decay times by looking at the RT60 graph " and "the RT60 graph doesn't give meaningful results " seem to contradict or im misunderstanding also.
 

UKSPAWN

Member
Joined
Jun 18, 2021
Messages
69
Location
Nottingham, UK
More  
Preamp, Processor or Receiver
SMSL SU-9 (Pre/Dac)
Main Amp
Rotel A12 (Fixed output mode)
Computer Audio
PC via USB - Foobar2000
DAC
SMSL SU-9 (Pre/Dac)
Universal / Blu-ray / CD Player
Sony UBP-X800M2
Front Speakers
Monitor Audio Bronze 5g
Subwoofers
SVS SB1000PRO 12" + MonoPrice MONOLITH THX 10"
Other Speakers or Equipment
MINI DSP 2x4HD (L+R+SW1+SW2)
Video Display Device
BENQ W2000
Screen
EliteScreens AEON CineGrey 100"
Remote Control
SmartIR device via android
Streaming Equipment
(potentially) SMSL SD-9
Streaming Subscriptions
Tidal Masters, Spotify Free, Youtube...
Satellite System
What is TV?
Other Equipment
FiiO FH5s IEM + FiiO Q1 MKII DAC/AMP
this one
 

Attachments

  • decay.png
    decay.png
    60.9 KB · Views: 19

xappn

New Member
Thread Starter
Joined
Jan 27, 2022
Messages
5
i think there has been a confusion. Use the "RT60 DECAY" i think is what was intended be said, as "RT60" isnt applicable to small rooms... is that right John?

Sweet! Ok, here is the RT60 Decay graph. I wasn't sure how much of the noise floor(?) would be helpful to display, so I used your .png as a guide. I also included a .gif of the graph, well, just in case, because I don't quite get what's important here yet.


Also, when I made the initial sweep, my monitoring level was set to comfortable, like a normal listening volume which for me would be quite low. I saw a post saying that you might need ear muffs when doing the sweep. Maybe I took the measurement with too little monitoring volume? Or does it matter that much?
 

Attachments

  • 27 01 2022 RT60 Decay.png
    27 01 2022 RT60 Decay.png
    44.2 KB · Views: 26
  • 27 01 2022 RT60 Decay.gif
    27 01 2022 RT60 Decay.gif
    9.5 MB · Views: 26
Last edited:

John Mulcahy

REW Author
Joined
Apr 3, 2017
Messages
7,348
Nice animation :)

The RT60 graph is OK to use, just ignore results below a couple of hundred Hz or so. The trace to look at is Topt, though T20, T30 and Topt are all estimates of the RT60 time, just based on different parts of the decay. The RT60 decay graph gives a more detailed view, and when used with narrow octave fractions can show the low frequency modal resonance behaviour as well. The room looks well damped and the decay uniformity is good. It is a little lumpy below 200 Hz, though much better than most. If the behaviour is similar across the positions that are used for listening you could apply a little EQ to bring down a couple of the bumps at the low end, but it looks good as is.

There is no need to use high levels for sweeps, a comfortable listening level is fine.
 

xappn

New Member
Thread Starter
Joined
Jan 27, 2022
Messages
5
Thank you both for the replies!

Ouch, with 1/48 octave band it doesn't seem to look as nice anymore! Attached.

Would you still consider the results good, or do the narrow octave fractions reveal something alarming?

From what I can tell the room could use some work in the ultra lows, 50, 75, 200, around 500 Hz, and around 1.5 khz, am I correct?

For example ~780ms decay at 75 Hz wouldn't be a good thing, would it? Maybe those places could use the EQ to bring them down a little?

Anyway I think I'm starting to get a grasp on this thing, I can take this with me to the Gearspace forum for treatment advice. Thank you, it really is much appreciated! And thanks John ol' buddy ol' pal for the great software! Good job.
 

Attachments

  • 27 01 2022 RT60 Decay 1_48.png
    27 01 2022 RT60 Decay 1_48.png
    68.8 KB · Views: 17
Top Bottom