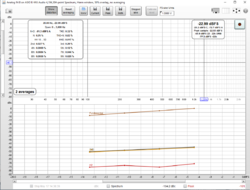
When doing a stepped sine measurement, with stepped levels, I notice the following:
- in the measurement setup popup, the number of averages is set at 2 minimum (rather than what I anticipated would have been 1) - maybe there is a reason for that, but otherwise it just extended the test sequence.
- the Y axis and X axis management of the bottom pane containing the stepped level plot is difficult to configure. The plot shows H1 H2 H3 THD, but the selection sub-pane doesn't provide the ability to select on/off each of those plotted values (it only shows aspects of the top pane). The plot Y-axis span can be adjusted using the 'set axis graph limits', but the X axis span in dBFS can't be adjusted afaik. The 'save the graph as an image' capture then goes to the setup box but then the save button causes a java error "java.lang.IllegalArgumentException: Width (1200) and height (0) cannot be <= 0 occurred", but there is no height control in the setup box - same occurs for jpg and png settings.
Ciao, Tim
Edit: doh, I just realised I had to go back to the main measurement page to be able to fully configure the stepped measurement plot.

Last edited:


