Hi there!
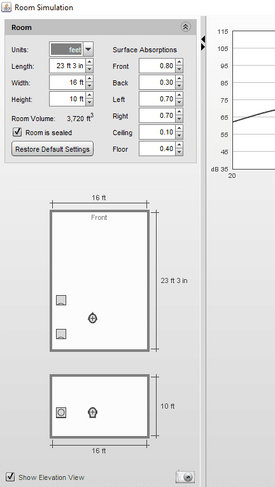
Does anybody have screenshots from REW of spectrograms/waterfall plots for BAD-sounding rooms? I wish to study these. They can be for 10'x10'x10' or other nasty dimensions. The screenshots should point out where most of the problem frequencies (or their groups) are located. I'd like to know how good are the calculators available on the web (or one's own EXCEL-based spreadsheets for modal calculations). Do the two match, and if they do, then how much?
Does anybody have screenshots from REW of spectrograms/waterfall plots for BAD-sounding rooms? I wish to study these. They can be for 10'x10'x10' or other nasty dimensions. The screenshots should point out where most of the problem frequencies (or their groups) are located. I'd like to know how good are the calculators available on the web (or one's own EXCEL-based spreadsheets for modal calculations). Do the two match, and if they do, then how much?
Last edited:


 Your message arrived just as I was reading the Sodom/Gomorrah/Abraham/Sara episode. No kidding! I don't know what THIS means acoustically! I had wandered off in the desert of Excel data for a short few days but certainly not for 40 years.


