REW-UMIK 1 Measurements (dbA, NC)

marstak

Registered
Thread Starter
Joined
Aug 17, 2023
Messages
1
Hi,

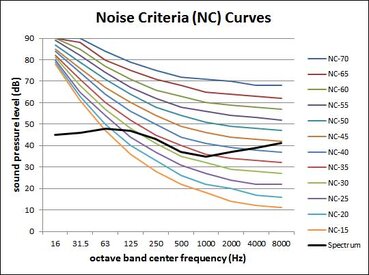
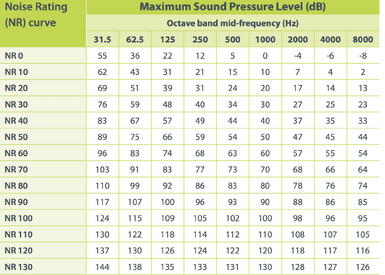
I am trying to characterize the acoustic spectrum of my room in the 100Hz-10kHz band using a UMIK 1 with the REW software. I would like to use the dBA (A weighted) scale and the NC (Noise Criterion) scale for the measurements.
I thought of doing it in 2 ways, taking the data logger time series from the SPL Meter and processing it later in python or by directly looking at the RTA spectrum. Here's where I'm caught with both measurements

SPL Meter:
It allows me to read the input in the dBA scale at a sampling rate of 48kHz which is great. However, when I try to export the data, it allows a default export option as a .txt file which has a sampling rate of ~170ms which is ~6Hz. Getting a spectrum from the given sampling would not be possible as its lower than the bandwidth within which I am trying to analyze.
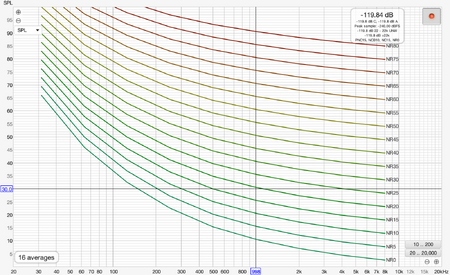
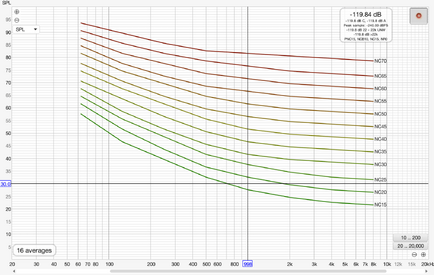
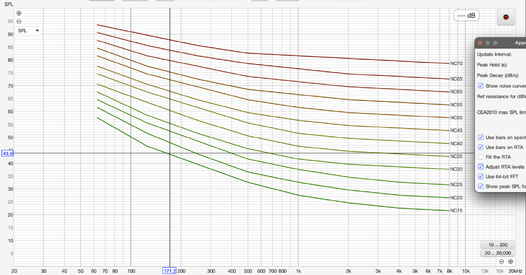
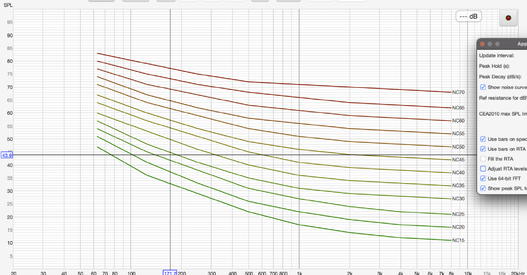
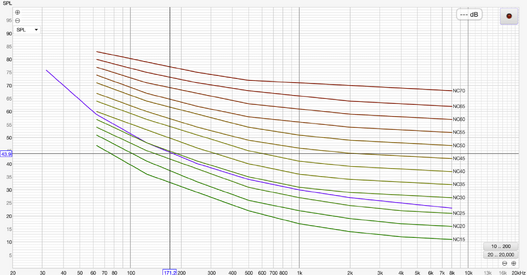
RTA Spectrum:
The RTA spectrum averages and produces the peak spectrum, however it does so only in the dB range. The data that it exports is in a .mdata format which is readable only in the REW software and cannot be accessed by python or processed on a third party software. The transfer function for A weighting is readily available, however it's useless if I cannot access the data.

Any help would be greatly appreciated!
 

olivierguillaume

Registered
Joined
Oct 23, 2017
Messages
6
Hello, I just look at the definition of NC et NR and it looks that there is a mistake in REW. At 1000Hz NR 30 curve is supposed to be 30dB. At 2000Hz NC30 curve is supposed to be at 30dB. You can see in the attached files that it's not the case. Am I wrong somewhere ?

Also, is it possible to show more than 1 measurement on the RTA window to compare severals measurements of room noises ?

Thank you !

Olivier
 

Attachments

  • Noise_Curves_Graph_Spectrum_with_NC.jpg
    Noise_Curves_Graph_Spectrum_with_NC.jpg
    35.9 KB · Views: 16
  • courbes_nr2.gif
    courbes_nr2.gif
    20.3 KB · Views: 17
  • Capture d’écran 2023-11-05 à 15.00.38.png
    Capture d’écran 2023-11-05 à 15.00.38.png
    152.3 KB · Views: 17
  • Capture d’écran 2023-11-05 à 15.00.20.png
    Capture d’écran 2023-11-05 à 15.00.20.png
    109.8 KB · Views: 19
Last edited:

John Mulcahy

REW Author
Joined
Apr 3, 2017
Messages
7,326
You have "Adust RTA levels" selected which shifts the graphs along the SPL axis depending on the FFT length.

The RTA can only show the currently selected measurement from the measurement list and the current capture.
 

olivierguillaume

Registered
Joined
Oct 23, 2017
Messages
6
Thank you for your response John !
So if I understand it well, "Adjust RTA levels" has to be unchecked to have the right levels of NC and NR ?

And there's no way to overlays different noise measeurements yet ? Is it a feature with can appear in the next versions ?
 

John Mulcahy

REW Author
Joined
Apr 3, 2017
Messages
7,326
"Adjust RTA levels" has to be unchecked to have the right levels of NC and NR ?
No, the correct NC or NR figures are shown whether it is selected or not.

And there's no way to overlays different noise measeurements yet ? Is it a feature with can appear in the next versions ?
No plans for it. You can go through measurements while looking at the RTA using the Alt+up/down arrow shortcuts, to see how they look against the curves.
 

olivierguillaume

Registered
Joined
Oct 23, 2017
Messages
6
No, the correct NC or NR figures are shown whether it is selected or not.
So why when this box is checked or not, the absolute value in Y axe (in dB SPL) changes (see attached screenshots below)?

And I can notice some difference between the value of NR and the REW ones (see the last 2 screenshots, exemple of NR30 in overlays)

Also, is it possible to get a text file (import>import frequency response) with those NR and NC data to display it in Overlays windows to compare different measurements in one window ?

Reference : https://www.cirrusresearch.co.uk/li...sound_level_meter_and_NoiseTools_software.pdf
 

Attachments

  • Capture d’écran 2023-11-06 à 00.26.00.png
    Capture d’écran 2023-11-06 à 00.26.00.png
    113.2 KB · Views: 8
  • Capture d’écran 2023-11-06 à 00.25.51.png
    Capture d’écran 2023-11-06 à 00.25.51.png
    112.8 KB · Views: 8
  • Capture d’écran 2023-11-06 à 00.45.05.png
    Capture d’écran 2023-11-06 à 00.45.05.png
    53.9 KB · Views: 7
  • Capture d’écran 2023-11-06 à 00.46.47.png
    Capture d’écran 2023-11-06 à 00.46.47.png
    91 KB · Views: 8
Last edited:

John Mulcahy

REW Author
Joined
Apr 3, 2017
Messages
7,326
From the help:

Adjust RTA Levels​

The RTA plot shows the energy within each octave fraction bandwidth. As the RTA resolution increases, from 1 octave through to 1/48 octave, the octave fraction bandwidths decrease and, for broadband test signals such as pink noise, the energy in each octave fraction decreases correspondingly. Whilst the RTA is correctly showing the actual level within each octave fraction, this variation of trace level with RTA resolution can be awkward when using the RTA with a pink PN noise signal to adjust speaker positions or equaliser settings. The Adjust RTA Levels option offsets the levels shown on the RTA plot to compensate for both the bandwidth variation as resolution is changed and the difference between a sweep measurement at a given sweep level and a pink PN RTA measurement at the same level, allowing direct comparison between RTA and sweep plots. Whilst the levels shown are not the true SPL in each octave fraction, they are more convenient to work with. N.B. This option should only be used with broadband test signals, such as pink noise or pink PN.

Also from the help:

Show noise curves​

If the Show noise curves option is selected when capturing a single input the chosen noise curves will be drawn on the graph when the RTA is in 1 octave mode and the Y axis is showing dB. The options are Preferred Noise Criterion (PNC), Balanced Noise Criterion (NCB), Noise Criterion (NC) and Noise Rating (NR). Note that if Adjust RTA levels is selected the curves will be offset by the same amount as the RTA trace, but this will not alter the noise criteria results.

is it possible to get a text file (import>import frequency response) with those NR and NC data
You can make you own response curve files using data from here, for example, but if you want to use it in an overlay with measurements saved from the RTA you would have to make sure Adjust RTA levels was turned off before saving the RTA captures.
 
Top Bottom