REW graph smoothing algorithm

Randolf

Registered
Thread Starter
Joined
Feb 25, 2024
Messages
3
More  
Main Amp
Yamaha R-N803D
DAC
minidsp DDRC-24
Front Speakers
Lowther Fidelio
Streaming Equipment
WiiM Pro
I have created a tiny command line frequency response display and comparison tool "FreqRespGraph" on github. It can also smooth curves using a Savitzky-Golay filter. However the results look rather different to REW results, which uses a IIR filter based approach:

  1. I need about twice the smoothing bandwidth e.g. 2/12 vs. 1/12 octave to create a very similar result.
  2. For broad bandwidth smoothing e.g. 1/1 octave the REW result looks strange to me. In a response with rolled off low and high frequency range the REW smoothed curve runs clearly above the raw data. The attached screenshot show raw data (orange), REW 1/12 (black) and 1/1 (blue) smoothed curve. This is not the case with my Savitzky-Golay filter (see examples in "FreqRespGraph" repository on github).
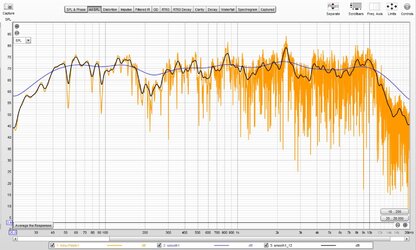
Am I doing something wrong or is there a problem in REW graph smoothing? Can anybody explain the difference? I would have expected only small differences.

rew.jpg
 

Randolf

Registered
Thread Starter
Joined
Feb 25, 2024
Messages
3
More  
Main Amp
Yamaha R-N803D
DAC
minidsp DDRC-24
Front Speakers
Lowther Fidelio
Streaming Equipment
WiiM Pro
Thanks a lot for the hint! Currently I am not using squared magnitudes for smoothing. I will give it a try. What is the idea behind using the squared magnitudes?
 

Randolf

Registered
Thread Starter
Joined
Feb 25, 2024
Messages
3
More  
Main Amp
Yamaha R-N803D
DAC
minidsp DDRC-24
Front Speakers
Lowther Fidelio
Streaming Equipment
WiiM Pro
Thanks again, I was able to fix it , now my smoothing results are very similar to REW. Using squared magnitudes did not really changed the result. However using a first order polynomial instead of second order one fixed the first issue. The second difference comes from how to generate data extensions required by the Savitzky-Golay filter. I used interpolation which basically extrapolates the data on both frequency boundaries. This is pretty plausible but using the nearest available data instead generates even a 1/1 smoothing result very similar to REW. It is more a matter of taste which one to use and only relevant at the frequency boundaries when using massive smoothing.

Giyen a log spaced "y" magnitude vector and "w" window length representing the octave smooting interval, the algorithm is as simple as that using SciPy:

y_smoothed = savgol_filter(y, w, 1, mode='nearest')
y_smoothed = np.flip(y_smoothed)
y_smoothed = savgol_filter(y_smoothed, w, 1, mode='nearest')
y_smoothed = np.flip(y_smoothed)
 
Top Bottom