REW equalizer "match the target" headache

Silverprout

Registered
Thread Starter
Joined
Jul 30, 2017
Messages
48
Hello,
(You can click on the thumbnails to enlarge them)

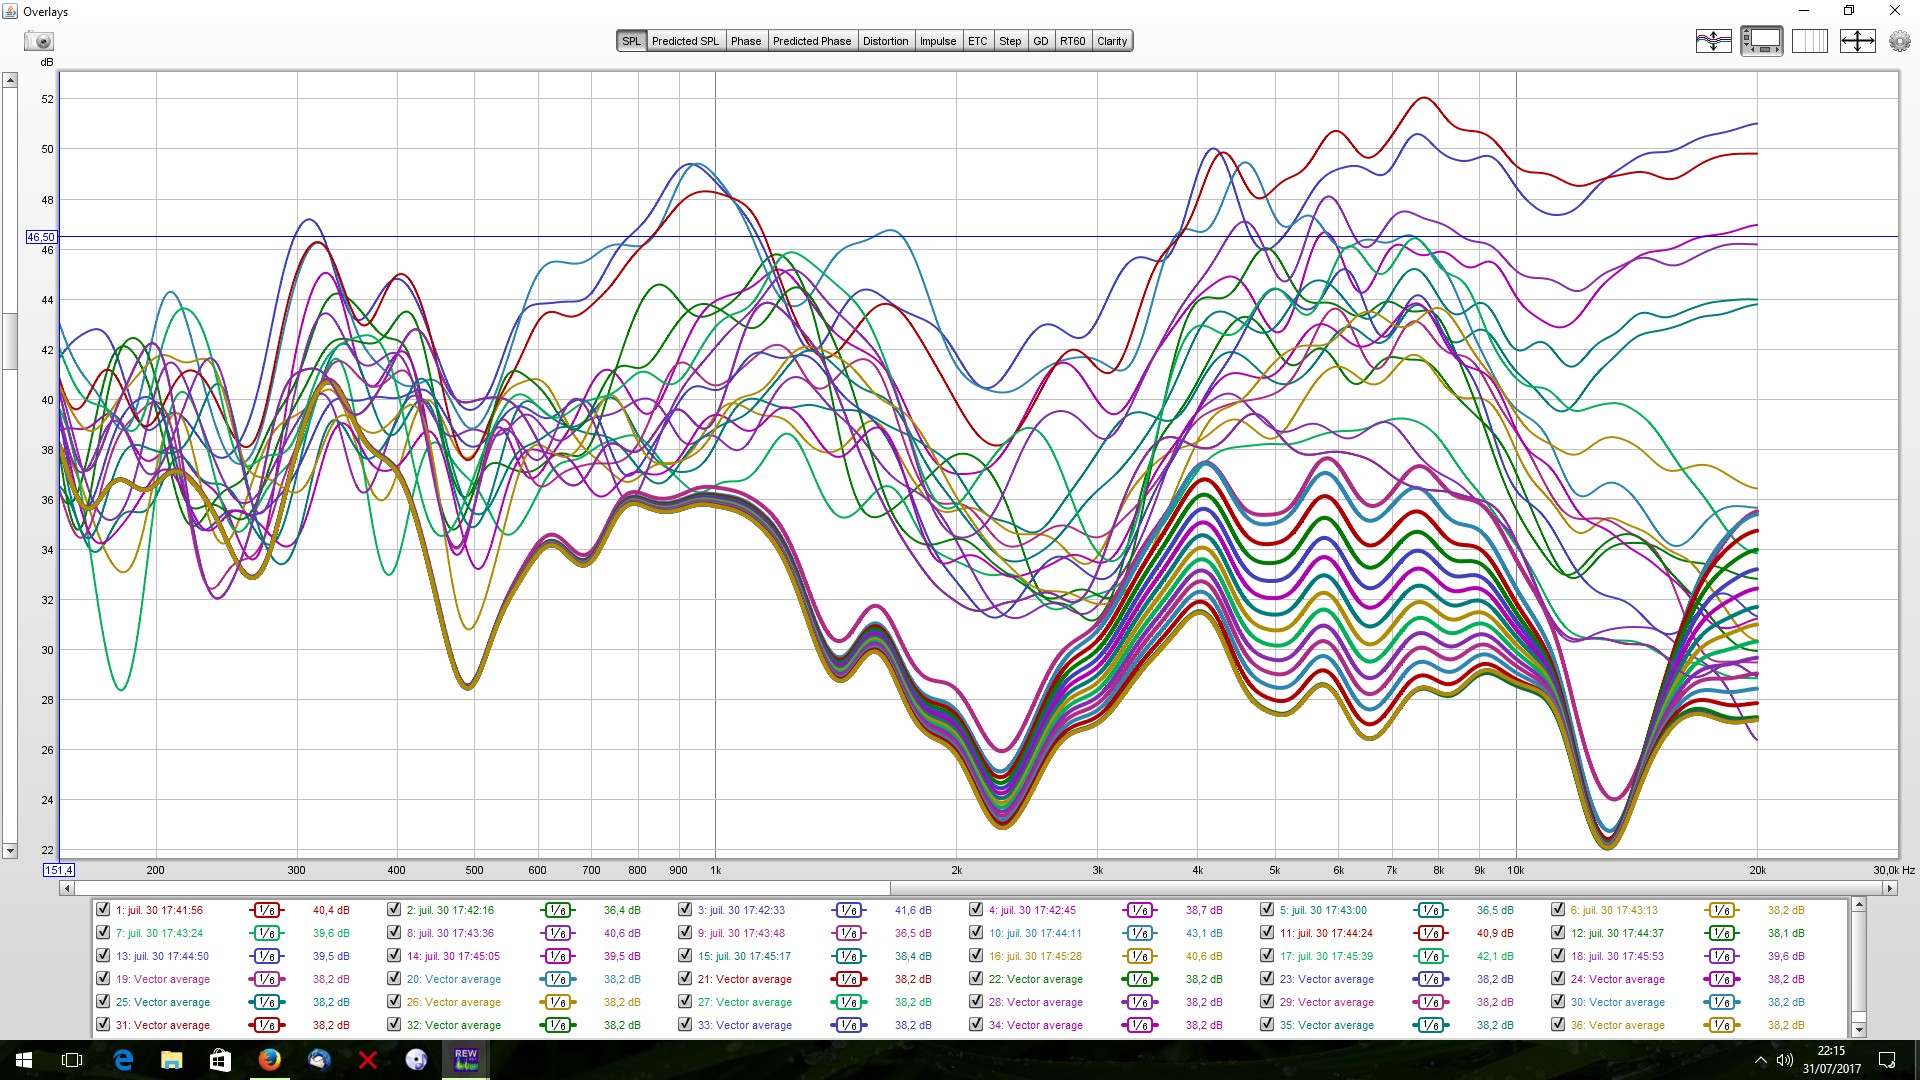
Here are my vector averaged measurements :


And what happened after pushing the "match the target" button !


Could you explain why there is no correction above 1000 Hz please ?
 

John Mulcahy

REW Author
Joined
Apr 3, 2017
Messages
7,289
That's because the whole response from there upwards lies below the target. REW will not generate filters for parts of the response that are lower in frequency that the first point the response crosses the target or higher than the last point, to avoid the risk of creating filters that try to push the system beyond its frequency extension limits.

The EQ graph would look a little more normal if you switch the axis from linear to log by the way.
 

Silverprout

Registered
Thread Starter
Joined
Jul 30, 2017
Messages
48
Thanks to take some of your time for me !

I've done it with the manual optimisation, and i know that these corrections are just a first approach, there is a lot of work.
So, i'm still on the equalization process and i've used 35 peaking filters.


Please ! could you add a profile with an unlimited quantity of filters in REW please ?
 
Last edited:

John Mulcahy

REW Author
Joined
Apr 3, 2017
Messages
7,289
It is almost always a bad idea to use narrow filters at frequencies above a few hundred Hz, the measurement features they address are highly location dependent. Using averaged measurements doesn't help with that. The effect of the filters will vary dramatically with even small changes in listening position. I would urge you to be very conservative with filters you apply above the bass range, and do not apply any narrow filters there. You should also be very careful with filters that apply boost, for similar reasons, dips in the response are also very location dependent. Using a lot of filters is a warning sign. This section of the help provides some context.
 

Silverprout

Registered
Thread Starter
Joined
Jul 30, 2017
Messages
48
I was afraid of that because my Q are usually between 1 and 6, i don't know why the default filters have a Q of 10... (tutorial also shows Q10 filters)
I must redo.

So... i try to read in the measurements cloud (i know which curves are the most important to treat for my listening position)


The averaged curves clearly shows where are the critical zones but IRL the treble needs to be tamed a lot and the dip at 13K totally ignored.
The 4K-10K should be tamed, the 2.2K dip should be raised and the 0.48K dip should be raised also.
And at the end the 0.322K peak should be tamed.
Are you agree ?
 

John Mulcahy

REW Author
Joined
Apr 3, 2017
Messages
7,289
Pretty difficult to say, you don't show which curves are the important ones and even then it would be hard to comment. I tend to think of EQ at high frequencies as having one of two purposes - it can be a tone control or it can be to correct a characteristic of the speaker. In the former case a shelf filter or broad (Q < 2) PK filters can be used. In the latter the measurements need to be of the speaker, not the room, so conditions that are as near anechoic as can be achieved and typically measured at 1m. Both speakers of a stereo pair need to have the same filtering at HF to avoid imaging problems.
 

Silverprout

Registered
Thread Starter
Joined
Jul 30, 2017
Messages
48
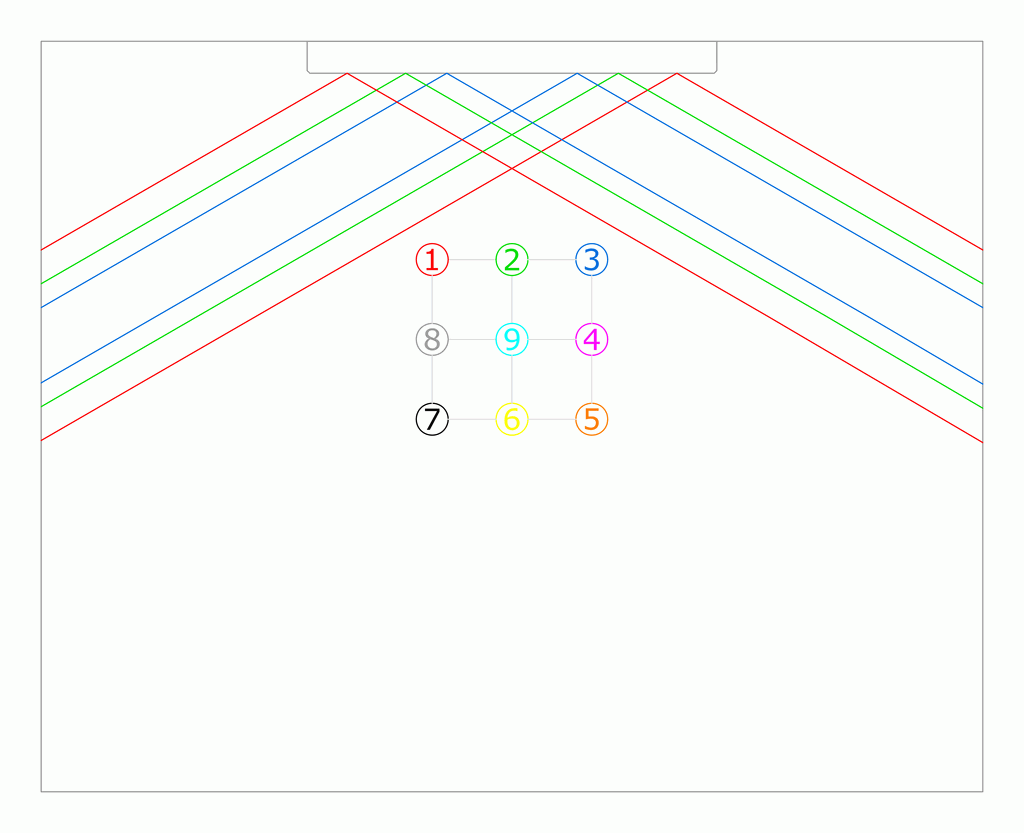
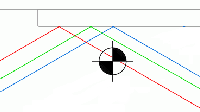
Here is the room with on wall loudspeakers (on a small table :)) and the the lines define the minimum covering angles at the crossover points (120°)
The red is covering the 0.8K to 0.4K range, the green is covering the 0.4K to 4K range ant the blue is covering the 4k to 20K range.
The 9 point is at one meter of the loudspeakers.


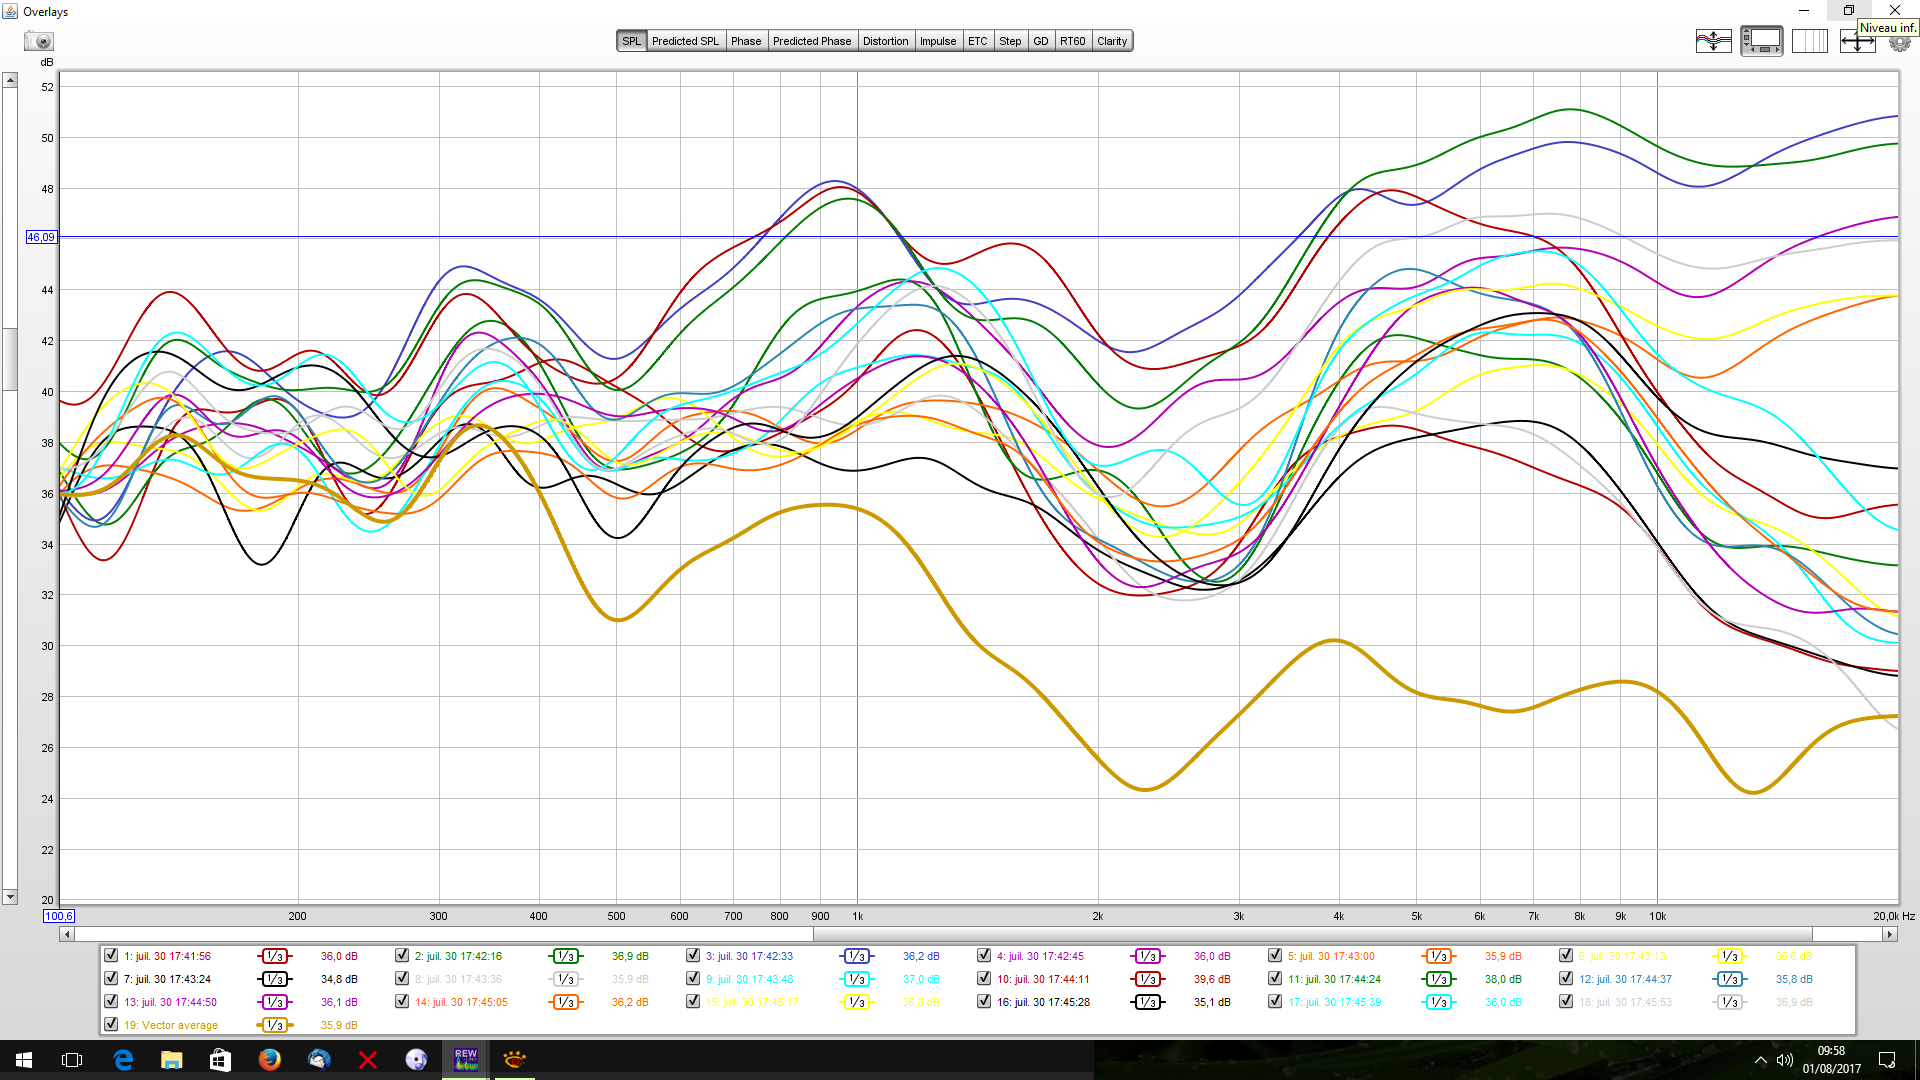
This is the corresponding curves to the measurements points matrix, the colors are matched (not perfectly), the graph exhibit two curves of the same color (right and left) and there is one averaged curve (for the fun)


The right and left response are not identical (except at the center), what would you do to equalize it please ?
 

Silverprout

Registered
Thread Starter
Joined
Jul 30, 2017
Messages
48
FIY.
The right and left 9 position is time aligned and averaged-vectorized in blue (not much measurements to average... must redo again)
The old averaging (DIY audio method) in orange.


Then... the equalizer works.


:woohoo:
 

John Mulcahy

REW Author
Joined
Apr 3, 2017
Messages
7,289
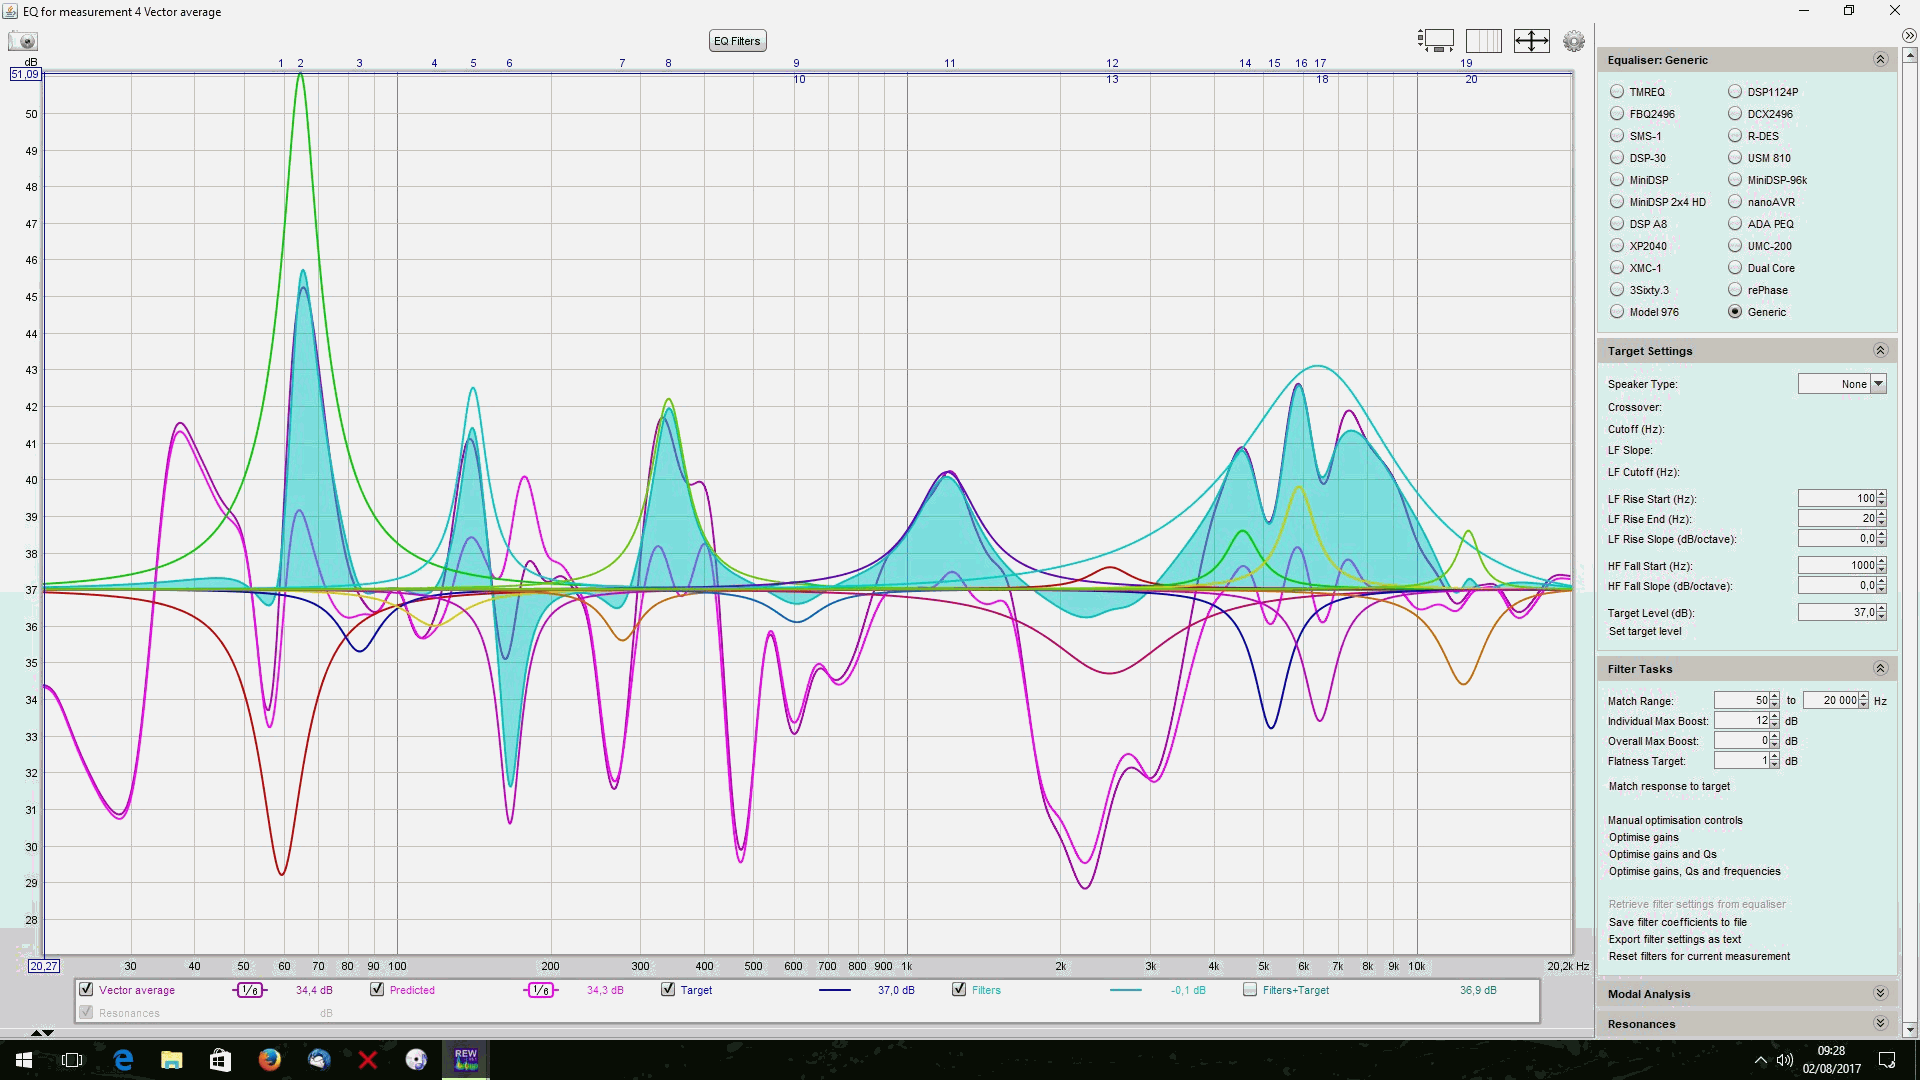
As I mentioned, using a linear frequency axis on the EQ window gives the graph a pretty odd appearance, is there a reason you don't use a normal log axis there?

I personally wouldn't apply EQ outside the bass range, but if you do use EQ on left and right above 100 Hz or so keep left and right filters the same, use very few filters, and adjust them until you like the sound you are getting.
 

Silverprout

Registered
Thread Starter
Joined
Jul 30, 2017
Messages
48
As I mentioned, using a linear frequency axis on the EQ window gives the graph a pretty odd appearance, is there a reason you don't use a normal log axis there?
I personally wouldn't apply EQ outside the bass range, but if you do use EQ on left and right above 100 Hz or so keep left and right filters the same, use very few filters, and adjust them until you like the sound you are getting.

Here is the logarithmic graph :


By ear (and measurements) i usually tame the treble and all the large peaks in the response.

Why wouldn't you apply EQ outside the bass range ?
 

John Mulcahy

REW Author
Joined
Apr 3, 2017
Messages
7,289
Because the ear and brain are very good at discriminating the direct sound from the later reflections and don't 'hear' what an in-room listening position measurement shows at high frequencies. If an anechoic measurement shows a speaker's response needs correction there is an argument for correcting that response, but the measurement needs to be of the speaker alone, not speaker+room. Tight windowing of the impulse response can give something approaching an anechoic measurement if the speaker and mic are as far as they can be from adjacent surfaces (including floor and ceiling).
 

Silverprout

Registered
Thread Starter
Joined
Jul 30, 2017
Messages
48
Because the ear and brain are very good at discriminating the direct sound from the later reflections and don't 'hear' what an in-room listening position measurement shows at high frequencies. If an anechoic measurement shows a speaker's response needs correction there is an argument for correcting that response, but the measurement needs to be of the speaker alone, not speaker+room. Tight windowing of the impulse response can give something approaching an anechoic measurement if the speaker and mic are as far as they can be from adjacent surfaces (including floor and ceiling).

Averaged near field measurements corrections are only useful for few hundred Hz in the LF and must prferably corrected with low Q peaking filters.
The very close loudspeaker frequency correction (when needed) should be performed also with low Q peaking filters when they are the best choice with a very tight windowing (outdoor measurement if possible)

For this measurement, if i want to be as close as possible to the loudspeaker and have the whole tweeter response (flat) i can't be closer than this :


Are you argee ?
 

John Mulcahy

REW Author
Joined
Apr 3, 2017
Messages
7,289
"As close as possible" isn't a good thing if you are trying to capture the speaker response, probably safer using 1m away on the tweeter axis.
 

Silverprout

Registered
Thread Starter
Joined
Jul 30, 2017
Messages
48
"As close as possible" isn't a good thing if you are trying to capture the speaker response, probably safer using 1m away on the tweeter axis.

1 meter is pefectly matching my listening distance, so i've performed my measurments :
REW is a powerful tool and a lot of errors seems to come from the lack of understanding... can you explain why these seven loudspeaker measurements FR looks so different from the averaged curve ?

170804072958572886.jpg
 
Last edited:

John Mulcahy

REW Author
Joined
Apr 3, 2017
Messages
7,289
The vector average takes into account both magnitude and phase, for that set phase differences between the measurements result in the average being below the individual measurements. If they are taken from the same position then either use a timing reference (loopback cable or acoustic) or time align the measurements before averaging.
 

Silverprout

Registered
Thread Starter
Joined
Jul 30, 2017
Messages
48
The vector average takes into account both magnitude and phase, for that set phase differences between the measurements result in the average being below the individual measurements. If they are taken from the same position then either use a timing reference (loopback cable or acoustic) or time align the measurements before averaging.

The phase differences between seven measurements (wich were performed without moving anything at all) are responsible of a -2dB variation of the curve, is this provoked by sound reflexions and diffractions ?

Can it be caused by the sligt movement of my body in the room (around 30 cm of postural imprecision) or by the erratic and unpredictible part of the sound propagation (deflexions due to the room internal air temprature gradient or pression gradient) ?
 

John Mulcahy

REW Author
Joined
Apr 3, 2017
Messages
7,289
Measurement 1 is the problem, if you exclude that the result is more as one would expect. Difficult to say what has gone wrong with it, but the IR for that measurement also shows some odd pre-ringing. Noise floor looks quite high for all the measurements.
 

Silverprout

Registered
Thread Starter
Joined
Jul 30, 2017
Messages
48
Measurement 1 is the problem, if you exclude that the result is more as one would expect. Difficult to say what has gone wrong with it, but the IR for that measurement also shows some odd pre-ringing. Noise floor looks quite high for all the measurements.

Is this odd pre-ringing can be caused by software latency or glitch ?
I've performed my first measurement very early and, perhaps, it was launched during heavy windows background processes ?
 

Silverprout

Registered
Thread Starter
Joined
Jul 30, 2017
Messages
48
Possibly, difficult to say.

I'm also using equalizer APO with an 8 channels active configuration... it sometimes generates short duration soft odd digital noises (i like it a lot :))
Measurement don't like them !
 

Silverprout

Registered
Thread Starter
Joined
Jul 30, 2017
Messages
48
Measurement 1 is the problem, if you exclude that the result is more as one would expect. Difficult to say what has gone wrong with it, but the IR for that measurement also shows some odd pre-ringing. Noise floor looks quite high for all the measurements.

My brain was tired out by an intensive day of soldering, here is the odd ringing measurement :

170806094544708241.png


And a "normal" measurement :

170806094637792482.png


I must measure again !
 
Top Bottom