


bobkatz
New Member
Thread Starter
- Joined
- Nov 28, 2017
- Posts
- 31
More
- Preamp, Processor or Receiver
- Main monitor controller: Cranesong Avocet (8 ch)
- Main Amp
- Atsah 500
- Universal / Blu-ray / CD Player
- Oppo
- Front Speakers
- Dynaudio Evidence M5P
- Center Channel Speaker
- Lipinski L-707
- Surround Speakers
- Lipinski L-505
- Subwoofers
- JL Fathom F-112 (2)
Hi, John. I would like to measure my room noise and apply a noise criterion assessment.
I found this graph of one-octave SPL to determine NC criteria:
The following table defines Noise Criteria Curves for the Sound Pressure Level measured as dB for each Octave Band center frequency in Hz. I can't seem to get the table into this thread so here's a link to it instead.

 www.crystalinstruments.com
It seems to me that in a very awkward way I could go into the EQ window and apply a house curve, at least one curve per each NC choice. But the house curve is relative, not absolute and so it would be an awkward workaround to achieve it.
Another way, I imagine, would be to put some kind of an overlay over the regular reading, if I could somehow take a measurement of the noise of the room rather than the signal (sweep). Or use the RTA to create a WAV file of the noise of the room and bring that into the main window. But the NC overlay, that would be interesting.
I imagine I could create several overlays using filtered pink noise, adjust their calibration amplitude to the above table, and overlay that over the room noise. What do you think?
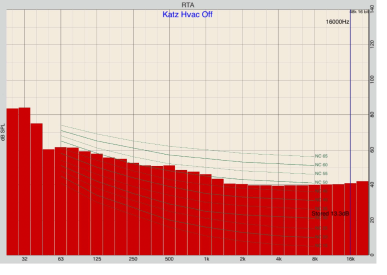
Attached is an NC-based measurement of my room, but not one-octave, produced by an acoustician in my room using his dedicated software. I find it hard to believe that my room is NC50! Must have been with the AC fan turned on. So I want to measure and confirm the NC rating myself. If I could create a graphic and overlay it over my room noise measurement, it would show the NC value in a similar way to the acoustician's measurement.
How can we conquer this apparently simple request?
I found this graph of one-octave SPL to determine NC criteria:
The following table defines Noise Criteria Curves for the Sound Pressure Level measured as dB for each Octave Band center frequency in Hz. I can't seem to get the table into this thread so here's a link to it instead.
Noise Criteria (NC) Curves
Noise Criteria (NC) curves are primarily used to rate indoor noise levels. It is important that the background noise levels are within acceptable limits to ensure optimal speech communication for structures ranging from residences and offices to hospitals and schools.
www.crystalinstruments.com
It seems to me that in a very awkward way I could go into the EQ window and apply a house curve, at least one curve per each NC choice. But the house curve is relative, not absolute and so it would be an awkward workaround to achieve it.
Another way, I imagine, would be to put some kind of an overlay over the regular reading, if I could somehow take a measurement of the noise of the room rather than the signal (sweep). Or use the RTA to create a WAV file of the noise of the room and bring that into the main window. But the NC overlay, that would be interesting.
I imagine I could create several overlays using filtered pink noise, adjust their calibration amplitude to the above table, and overlay that over the room noise. What do you think?
Attached is an NC-based measurement of my room, but not one-octave, produced by an acoustician in my room using his dedicated software. I find it hard to believe that my room is NC50! Must have been with the AC fan turned on. So I want to measure and confirm the NC rating myself. If I could create a graphic and overlay it over my room noise measurement, it would show the NC value in a similar way to the acoustician's measurement.
How can we conquer this apparently simple request?

")


