ISO3382 parameters value orange/red colour meaning

MattDz

Registered
Thread Starter
Joined
Feb 4, 2021
Messages
5
Hi

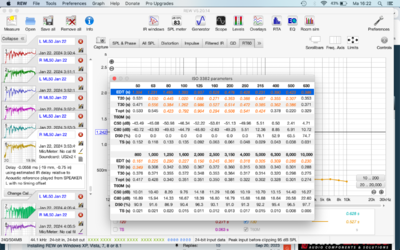
Running REW V5.20.14 64-bit on OS X 10.15.7. When reviewing my measurements, the RT60 tab gives me a nice overview of values of some ISO 3382 parameters in 1/3-octave bands. Very handy. But what does the colour coding mean? Some values are black, some values are orange/red (see attached screenshot). What does their colour mean? Orange = non-valid measurement/calculation? Out of limits? Can't find an explanation in manual or online!

Thanks!
 

Attachments

  • Schermafbeelding 2024-01-22 om 16.22.56.png
    Schermafbeelding 2024-01-22 om 16.22.56.png
    147.3 KB · Views: 10

John Mulcahy

REW Author
Joined
Apr 3, 2017
Messages
7,351
It's in the RT60 graph help, unreliable figures are italicised and shown orange. Values are considered unreliable if the magnitude of the correlation coefficient of the line fit is less than 0.99.
 

MattDz

Registered
Thread Starter
Joined
Feb 4, 2021
Messages
5
Thanks for the reply. Can you elaborate on this line fit please? I'm not sure how to interpret the unreliability of the EDT values in aforementioned screenshot, since all T20 and T30 in bands > 1000 Hz are deemed reliable, but not EDT?

Trying to figure out what's the cause if this unreliability of measurements. If it's a problem with measurement level/noise floor, unreliability would show up in T20 and T30 sooner than EDT, right? Since EDT is measured from 0 to -10 on Schroeder curve, T20 from -5 to -25 and T30 from -5 to -35.

Thanks.
 

John Mulcahy

REW Author
Joined
Apr 3, 2017
Messages
7,351
The RT60 parameters are calculated by best fit of a straight line to the Schroeder curve data over the relevant decay range. The slope of the line gives the parameter value, the correlation coefficient indicates how good a fit a straight line is to the data. All the measures are based on an assumption of a diffuse field, which holds for large spaces but not for smaller spaces, especially below the room's transition frequency, and may not hold for coupled spaces which can exhibit multi-stage decays. You can look at the Filtered IR graph to see the Schroeder curve for any chosen band and see the regression line for whichever parameter you select in the graph controls.
 
Top Bottom