Hi John, I'm just setting up to do some impedance measurements and have some process comments on V5.20 Beta 55 on Windows 10.
When going through the impedance calibration in the Make a Measurement dialog box, the help notes (http://www.roomeqwizard.com/betahelp/help_en-GB/html/impedancemeasurement.html#top) don't clarify how to input a value for the Reference Resistor calibration and that is only identified in the third step of the calibration process. The dialog box also shows a panel for R input which is a bit confusing as that is not described in the help and it is a bit strange as it defaults to 20,000 and although the value can be modified it just defaults back to 20,000 whenever any action occurs.
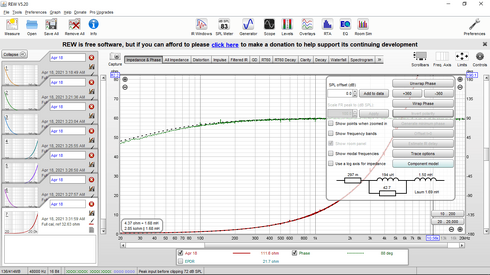
When I 'capture' the plot screen it doesn't allow the equivalent circuit values for the DUT to be saved in the image (the values seen when the cursor is over the plot) - that capability would be very helpful as I certainly use the saved image as the measurement record.
My last comment is that I'm thinking there is an issue with the REW calculation for the equivalent series impedance (R+L) representation, and was hoping you could indicate what I am missing in this regard - some details:
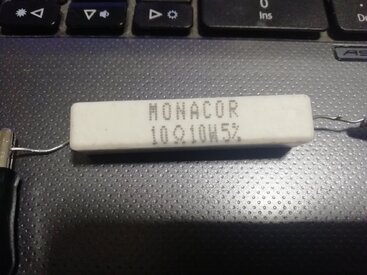
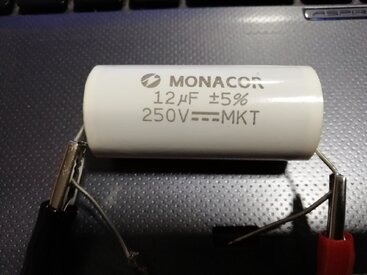
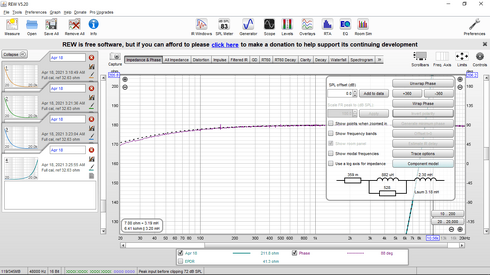
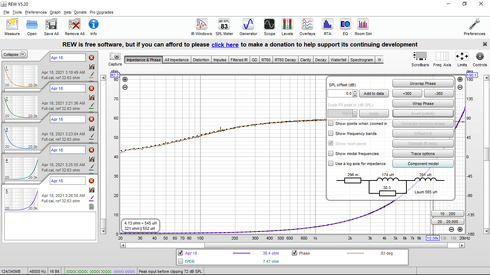
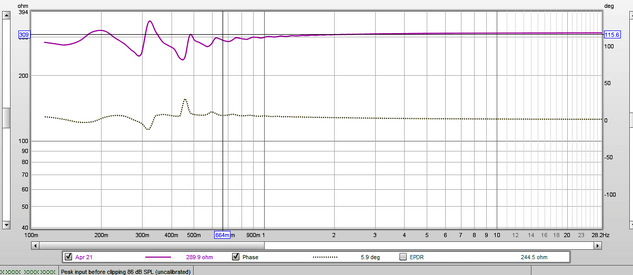
I'm pretty sure I have an ok test setup as measured results are accurate for various precision resistances (from 10 to 10k) and air-cored inductances (I have some second grade references of 10u and 100uH) and capacitors, but there is a noticeable error with an audio transformer winding that has a 230 ohm DC resistance (measured by a few meters and the nominal spec from the manufacturer), but the impedance plot shows the winding as having a low-frequency impedance of 315 ohm (in the flat impedance section below 1kHz).
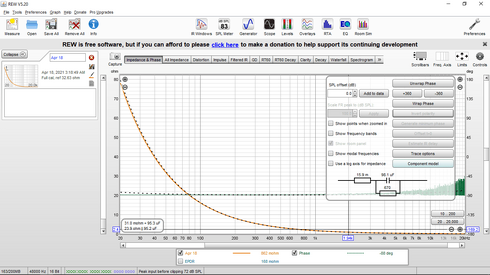
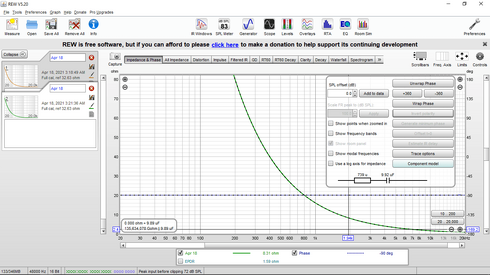
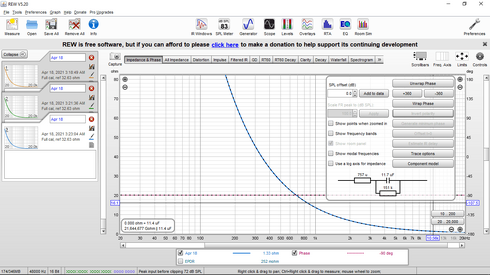
The DUT is a valve amplifier output transformer primary winding - with large inductance (10's of Henry at the low signal levels used for measurement). The test setup doesn't allow the DC resistance to show up for open windings as the impedance of the inductance is greater than the DCR down at 2Hz. But my interest is the leakage inductance of the winding (all other windings on the transformer shorted), where the winding DCR should measure as expected at low frequencies. I have repeated the measurement a few times and also added a 100 ohm resistor in series and it shows the impedance increasing from 315 to 415 ohm. The equivalent series impedance shown by REW is 315 ohm + 11.9mH at low frequency. The impedance and phase plots of the DUT are pretty noiseless up to 90kHz and show the high frequency resonances nicely that I am interested in (and have confirmed by other measurement means as well). The winding is not being saturated or operated in a non-linear region, and I get the same REW calculated low frequency resistance when the drive signal (EMU0404 USB headphone output) is lowered.

When going through the impedance calibration in the Make a Measurement dialog box, the help notes (http://www.roomeqwizard.com/betahelp/help_en-GB/html/impedancemeasurement.html#top) don't clarify how to input a value for the Reference Resistor calibration and that is only identified in the third step of the calibration process. The dialog box also shows a panel for R input which is a bit confusing as that is not described in the help and it is a bit strange as it defaults to 20,000 and although the value can be modified it just defaults back to 20,000 whenever any action occurs.
When I 'capture' the plot screen it doesn't allow the equivalent circuit values for the DUT to be saved in the image (the values seen when the cursor is over the plot) - that capability would be very helpful as I certainly use the saved image as the measurement record.
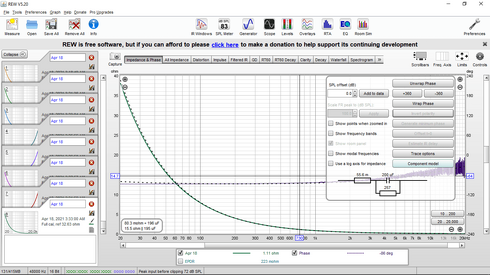
My last comment is that I'm thinking there is an issue with the REW calculation for the equivalent series impedance (R+L) representation, and was hoping you could indicate what I am missing in this regard - some details:
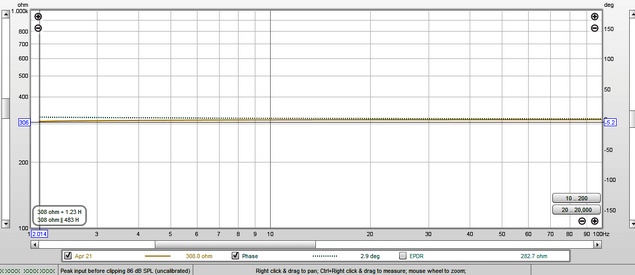
I'm pretty sure I have an ok test setup as measured results are accurate for various precision resistances (from 10 to 10k) and air-cored inductances (I have some second grade references of 10u and 100uH) and capacitors, but there is a noticeable error with an audio transformer winding that has a 230 ohm DC resistance (measured by a few meters and the nominal spec from the manufacturer), but the impedance plot shows the winding as having a low-frequency impedance of 315 ohm (in the flat impedance section below 1kHz).
The DUT is a valve amplifier output transformer primary winding - with large inductance (10's of Henry at the low signal levels used for measurement). The test setup doesn't allow the DC resistance to show up for open windings as the impedance of the inductance is greater than the DCR down at 2Hz. But my interest is the leakage inductance of the winding (all other windings on the transformer shorted), where the winding DCR should measure as expected at low frequencies. I have repeated the measurement a few times and also added a 100 ohm resistor in series and it shows the impedance increasing from 315 to 415 ohm. The equivalent series impedance shown by REW is 315 ohm + 11.9mH at low frequency. The impedance and phase plots of the DUT are pretty noiseless up to 90kHz and show the high frequency resonances nicely that I am interested in (and have confirmed by other measurement means as well). The winding is not being saturated or operated in a non-linear region, and I get the same REW calculated low frequency resistance when the drive signal (EMU0404 USB headphone output) is lowered.

")