REW Beta Release I don't understand a thing

maverikc

Registered
Thread Starter
Joined
Jan 23, 2021
Messages
22
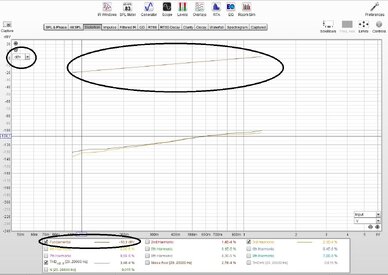
Hi. I don't understand a thing. When I view the distortion versus input voltage graph
and select dB for the Y axis, the graph is clear to me.
4.jpg

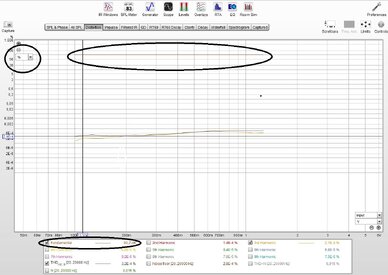
But when I change for the y axis from dB to % the
input signal (in the graph) is represented as a constant with a very high dB value.
3.jpg

Thanks for those who want to help me
 

John Mulcahy

REW Author
Joined
Apr 3, 2017
Messages
7,342
When distortion is plotted in percent everything is a percentage of the input level, so the input level itself is 100 %. REW shows you the dB level of the input in the legend as the level may have varied versus frequency, but that can't be shown on a percentage graph.
 

maverikc

Registered
Thread Starter
Joined
Jan 23, 2021
Messages
22
When distortion is plotted in percent everything is a percentage of the input level, so the input level itself is 100 %. REW shows you the dB level of the input in the legend as the level may have varied versus frequency, but that can't be shown on a percentage graph.
Thanks John
 
Top Bottom