


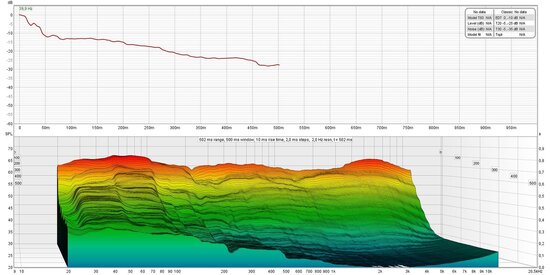
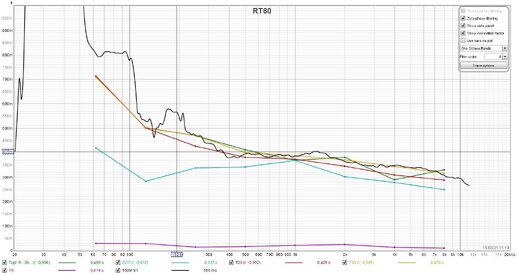
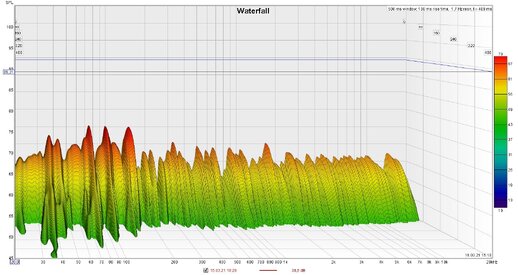
Help RT60 Decay
- Thread starter AlexK1967
- Start date
-
- Tags
- rt60 decay


Popular tags
20th century fox
4k blu-ray
4k uhd
4k ultrahd
action
adventure
animated
animation
bass
blu-ray
calibration
comedy
comics
denon
dirac
dirac live
disney
dolby atmos
drama
fantasy
hdmi 2.1
home theater
horror
kaleidescape
klipsch
lionsgate
marantz
movies
onkyo
paramount
pioneer
rew
romance
sci-fi
scream factory
shout factory
sony
stormaudio
subwoofer
svs
terror
thriller
uhd
ultrahd
ultrahd 4k
universal
value electronics
warner
warner brothers
well go usa