Help me understand "windowing" - (I'm trying to solve a frequency response "null")

ReDRuM

Registered
Thread Starter
Joined
Aug 14, 2017
Messages
16
Hello,

I’m trying to figure out which surface is the source of a nasty reflection that’s causing me headaches, I hope someone can help. Questions are numbered, for easier navigation :) But feel free to refer to whatever :)


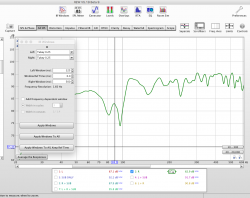
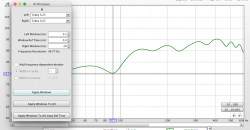
The dip is around 90 Hz or so:

1.png


Engaging the sub fixes it (the sub is low passed relatively high), but I still get some weird stereo image shifts at and around that frequency range.

I’m trying to use the windowing functionality to exclude some reflections from the graph, but I’m not sure I am using it properly. REW help states (related to windowing and frequency response) that “the lowest frequency is 1/T”. This means that:

1. In order to be able to conclude anything meaningful about the frequency range above 90 Hz, the right window needs to be longer than 11 ms. Correct?


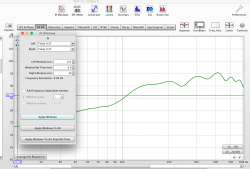
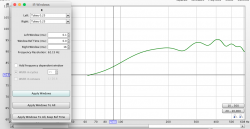
- If the above is correct, then: If I set the window to 11 ms, or even 18 ms, the dip does not appear:

2.png


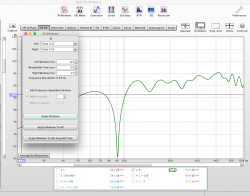
- The dip starts appearing at 20 ms, and is deepest at 27 ms:

3.png


2. Does this mean that it’s safe to conclude that this reflection definitely doesn’t arrive sooner than 20 ms after direct sound?


3. This would place the offending surface relatively far away, correct? Which is confusing me a bit, because ceiling or floor could be a likely culprit for this reflection - but these would happen much sooner.

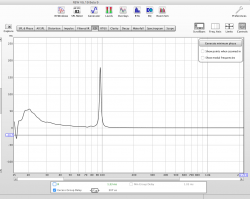
Also, this is the group delay graph for the R speaker (the above measurements are all also R speaker only):

4.png


- GD for the sub is flat.
- I haven't performed the loopback measurement

MDAT is attached.

P.S. - I’m not only trying to solve the dip issue, I’m also trying to understand REW functionality in a bit more depth, so sorry for all the questions. Thank you in advance! :)
 

Attachments

  • ReDRuM Studio.mdat
    18.5 MB · Views: 12
Last edited:

jtalden

Senior Member
Joined
May 22, 2017
Messages
888
Location
Arizona, USA
More  
Preamp, Processor or Receiver
Marantz AV7705 Pre/Pro
Main Amp
VTV 6 chnl NC252MP P-amp x 2
Additional Amp
Behringer DCX2496 x 2
Universal / Blu-ray / CD Player
OPPO BDP-103 Universal Player
Front Speakers
DIY SEAS H1456/H1212 Spkr x 5
Subwoofers
DIY JBL 2235H 15" SW x 2
Video Display Device
JVC DLA-X790R
Screen
Da-Lite Da-Snap 39105V - 92"
The R channel appears to have a room mode at ~ 90 Hz. It shows up in the L channel as well, but not as strongly. I don't know if this could possibly a reflection rather than a mode. There is a lot here to discuss so I will only comment on a couple things I have some comfort addressing. It will at least get you started.

Regarding Question #1:
  • The statement is true if the window settings are properly chosen.
  • The left window also needs to be set to the point just before the impulse. This sets the total window length (L window + R Window) properly to allow REW to properly calculate the lowest frequencies that are calculated significantly. REW will then truncate the trace below that lower frequency limit.
  • The resolution of the data is also significantly reduced near that cutoff frequency. The general direction and shape is correct, but the limited data in the first octave or two from the cutoff hides some of the SPL irregularity that is caused by later arriving data.
Below is the chart with the left/right windows set to 0.1/11 ms so the total window width is 11.1 ms.

1 R windowed.jpg


As an aside, I don't know your equipment / settings capabilities, but a review of the .mdat you provided indicates the timing of the SW to mains is not favorable. Assuming the R and Sub measurements were taken with the intended XO active (and it appears it they were) a much better timing of the handoff would be obtained with the Sub inverted in polarity and the Sub delay reduced by 9.5 ms. I will show the impact of this in my next post.
 

jtalden

Senior Member
Joined
May 22, 2017
Messages
888
Location
Arizona, USA
More  
Preamp, Processor or Receiver
Marantz AV7705 Pre/Pro
Main Amp
VTV 6 chnl NC252MP P-amp x 2
Additional Amp
Behringer DCX2496 x 2
Universal / Blu-ray / CD Player
OPPO BDP-103 Universal Player
Front Speakers
DIY SEAS H1456/H1212 Spkr x 5
Subwoofers
DIY JBL 2235H 15" SW x 2
Video Display Device
JVC DLA-X790R
Screen
Da-Lite Da-Snap 39105V - 92"
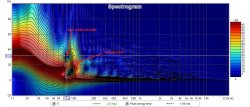
I also intended to point out that the null at ~90 Hz
appears
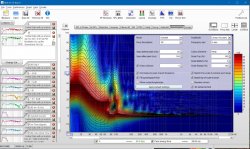
at 11 ms. this is 1 wavelength. The null at ~80 ms appears at ~32 ms. This can be easily seen on the spectrogram. The experts here can better comment on the source and significance of these timings.

2 R Spectrogram.jpg
 

jtalden

Senior Member
Joined
May 22, 2017
Messages
888
Location
Arizona, USA
More  
Preamp, Processor or Receiver
Marantz AV7705 Pre/Pro
Main Amp
VTV 6 chnl NC252MP P-amp x 2
Additional Amp
Behringer DCX2496 x 2
Universal / Blu-ray / CD Player
OPPO BDP-103 Universal Player
Front Speakers
DIY SEAS H1456/H1212 Spkr x 5
Subwoofers
DIY JBL 2235H 15" SW x 2
Video Display Device
JVC DLA-X790R
Screen
Da-Lite Da-Snap 39105V - 92"
You have a very wide XO range in this data so it may be that you have disabled the XO for the L, R channels for those measurements. If so the following analysis is not accurate. It does provide general direction however and may thus be helpful.

The best phase tracking between the Sub and R speakers is achieved with the Sub inverted and the Sub delay reduced by ~9.5 ms. Optionally, a Sub distance change of +10.75 ft. can be used. The calculated impact of this is shown below:

3 R SPL Orig Vs Time Aligned.jpg


4 Phase Tracking.jpg


5 R Spectrogram.jpg


The L channel was not analyzed, but should be equally fine with this change.

Again, if there was XO filter defeated for the measurements of the R channel, then this analysis is only directionally correct. The actual delay and polarity change may be impacted somewhat.

I don't know if this will influence in the sound qualities issues you detected, but it is a significant change.
 

Matthew J Poes

AV Addict
Joined
Oct 18, 2017
Messages
1,903
You can’t really identify the source without detailed measurements of the room dimensions, speaker placement, mic placement, and even then, if the room isn’t truelt cuboid you are still likely guessing.

You can use binaural impulse measurements or possibly a cardioid mic with shading or careful aiming to try to pinpoint the source.

A simple way to differentiate SBiR from modes is to take multiple measurements with the mic in different locations. Then move the source and repeat the exact measurements. Then do it again. Calculate the expected modes and expected SBIR and look for which seem to best match modes and which seem to best match SBIR (which should move drastically with speaker movement but not mic movement). Modes should remain constant regardless of speaker and mic placement but will in fact show up different with an Omni mic because you hit high pressure or high velocity points as you move it.

Of course some will lie on top of each other and then it’s a guess. I don’t usually find it important to precisely track it down and just mess with the treatment and speaker placement to get the smoothest response and minimize the excitation of the most detrimental modes.

I know that isn’t so helpful. It’s likel that the only true way to fully zero in on this through measurements and to take he guesswork and uncertainty out of the equation is to create a mesh model of the room with accurate characterizations of the barrier impedance and then a 3D mic measurement at various locations. I still imagine you would have to move the speakers, but at that point you can combine pressure measurements of the room and overlay them on the mesh model along with do a simulation of the source through BEM. They only time I ever experienced such a thing had an expert at the helm and it was mostly Greek to me. I understood the concepts generally but it was pretty out there.
 

ReDRuM

Registered
Thread Starter
Joined
Aug 14, 2017
Messages
16
Firstly, thank you jtalden and Matthew for the help, much appreciated!

You can’t really identify the source without detailed measurements of the room dimensions, speaker placement, mic placement,..

I should have chosen my words more carefully, sorry about that. I understand everything you wrote... I wasn't trying to read the source from the data "literally"... What I meant was, if I can be certain that the offending reflection happens later than, say 11 ms, I can rule out some reflection points, nothing more.


The R channel appears to have a room mode at ~ 90 Hz. It shows up in the L channel as well, but not as strongly.

I'm pretty sure that it's SBIR, and not a mode. The room is quite heavily treated, and I tried moving the mic around, the "ring tail" doesn't appear.

...the .mdat you provided indicates the timing of the SW to mains is not favorable...

A lot of what you wrote here related to figuring out the best setup for mains to SW is very valuable to me, so thanks for that! I would however like to focus, for now, on figuring out the "windowing" thing, which would perhaps lead me to taming the ~90 Hz null. Then I will have a much cleaner canvas for optimizing the sub setup.

I also intended to point out that the null at ~90 Hz appears at 11 ms. this is 1 wavelength. The null at ~80 ms appears at ~32 ms. This can be easily seen on the spectrogram. The experts here can better comment on the source and significance of these timings.

View attachment 8714

Very interesting, but I don't see it, please clarify... Regardless of the left side window, I don't see the ~90 Hz null appearing until the right window is set to ~20 ms:

20 ms.png

If below, then it's not there:

Screen Shot 2018-06-30 at 14.31.14.png

I understand that I'm perhaps misinterpreting the data. Perhaps this relates to the resolution "quality" you mentioned? You can see the dip appear at 11 ms (because you are interpreting the data properly), but the resolution is "HD" only at longer right window values? If so, is it possible to be certain this is the case?

Thank you again!
 

ReDRuM

Registered
Thread Starter
Joined
Aug 14, 2017
Messages
16
And if what you wrote above is correct -> That the 90 Hz null starts appearing right at the window size where 90 Hz starts "showing up" at all (1/T), then it is possible that the offending reflection actually arrives even sooner? Say 5,6 ms (this would be 1/2 λ extra path = 100 Hz dip SBIR)?

This is really the main thing I would like to figure out :)
 
Last edited:

John Mulcahy

REW Author
Joined
Apr 3, 2017
Messages
7,322
Reducing the window width changes not just the lower bound for a valid response but also the frequency resolution, with such short windows the resolution will not be sufficient to show any sharp dip at low frequencies.
 

jtalden

Senior Member
Joined
May 22, 2017
Messages
888
Location
Arizona, USA
More  
Preamp, Processor or Receiver
Marantz AV7705 Pre/Pro
Main Amp
VTV 6 chnl NC252MP P-amp x 2
Additional Amp
Behringer DCX2496 x 2
Universal / Blu-ray / CD Player
OPPO BDP-103 Universal Player
Front Speakers
DIY SEAS H1456/H1212 Spkr x 5
Subwoofers
DIY JBL 2235H 15" SW x 2
Video Display Device
JVC DLA-X790R
Screen
Da-Lite Da-Snap 39105V - 92"
Very interesting, but I don't see it, please clarify... Regardless of the left side window, I don't see the ~90 Hz null appearing until the right window is set to ~20 ms:

The comment in Post 3 was referring to the spectrogram chart in Post 3 that shows the ~90 Hz
null
appears at 11 ms. I left the cursor on the 80 Hz null that arrives at ~32 ms. I don't how to definitively determine the cause from this data.

Note the 3rd bullet in Post 2 that suggests that the window width need to be a minimum of twice the period of the frequency of interest to see any real detail of the SPL response. Otherwise, the impact of room is greatly diminished by the elimination of the later arriving data. That suggest a minimum of 22 ms. This is basically what you found.
 

ReDRuM

Registered
Thread Starter
Joined
Aug 14, 2017
Messages
16
Reducing the window width changes not just the lower bound for a valid response but also the frequency resolution, with such short windows the resolution will not be sufficient to show any sharp dip at low frequencies.

Understood, thanks. Is my understanding above correct? With the right side window set to 11 ms, the 90 Hz dip already starts appearing, so it is impossible to know if it actually appears sooner?
 

ReDRuM

Registered
Thread Starter
Joined
Aug 14, 2017
Messages
16
The comment in Post 3 was referring to the spectrogram chart in Post 3 that shows the ~90 Hz
null
appears at 11 ms. I left the cursor on the 80 Hz null that arrives at ~32 ms. I don't how to definitively determine the cause from this data.

Note the 3rd bullet in Post 2 that suggests that the window width need to be a minimum of twice the period of the frequency of interest to see any real detail of the SPL response. Otherwise, the impact of room is greatly diminished by the elimination of the later arriving data. That suggest a minimum of 22 ms. This is basically what you found.

I think I understand what you mean, but I'm having a hard time replicating your spectrogram. Could you please share the settings, so I can explore?
 
Last edited:

jtalden

Senior Member
Joined
May 22, 2017
Messages
888
Location
Arizona, USA
More  
Preamp, Processor or Receiver
Marantz AV7705 Pre/Pro
Main Amp
VTV 6 chnl NC252MP P-amp x 2
Additional Amp
Behringer DCX2496 x 2
Universal / Blu-ray / CD Player
OPPO BDP-103 Universal Player
Front Speakers
DIY SEAS H1456/H1212 Spkr x 5
Subwoofers
DIY JBL 2235H 15" SW x 2
Video Display Device
JVC DLA-X790R
Screen
Da-Lite Da-Snap 39105V - 92"
Select: Wavelet / default settings / Generate

6 Spectrogram Settings.JPG
 

ReDRuM

Registered
Thread Starter
Joined
Aug 14, 2017
Messages
16
Select: Wavelet / default settings / Generate

View attachment 8723

Thanks, that worked. But now I'm super confused :greengrin:

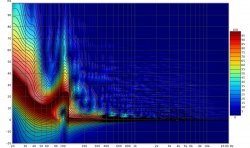
If setup that way, the R speaker measurement makes sense I guess (the one you posted). It shows maximum level at t=0, and then it shows "dips" occurring later on.

But the L speaker looks like this:

Untitled.jpg


I would read this as: Close to "zero level" at 100 Hz at t=0, with max at 20 ms... I can't make sense of that :)

EDIT: I made sense of that, it's called a reflection :)
 
Last edited:

ReDRuM

Registered
Thread Starter
Joined
Aug 14, 2017
Messages
16
EDIT: Ignore this, completely wrong :greengrin:

If I had to guess, I'd guess this:

On the spectogram, if a frequency range shows close to zero level at t=0, this probably means that the reflection causing the dip happens sooner than the "lower bound" necessary for extremely precise interpretation (1/T). Just thinking out loud, hope it makes sense :)
 
Last edited:

jtalden

Senior Member
Joined
May 22, 2017
Messages
888
Location
Arizona, USA
More  
Preamp, Processor or Receiver
Marantz AV7705 Pre/Pro
Main Amp
VTV 6 chnl NC252MP P-amp x 2
Additional Amp
Behringer DCX2496 x 2
Universal / Blu-ray / CD Player
OPPO BDP-103 Universal Player
Front Speakers
DIY SEAS H1456/H1212 Spkr x 5
Subwoofers
DIY JBL 2235H 15" SW x 2
Video Display Device
JVC DLA-X790R
Screen
Da-Lite Da-Snap 39105V - 92"
You may understand this better than I do as I do not understand your comment.

I also have 0 ms nulls on the wavelet spectrograph in my setup. I think they are relatively common. as I have them in the 2 different setups I have and have seen them in the
measurements of other's.​

I also am not sure if they point to a clear, unique cause. An SBIR (1/4 WL) reflection would still seem to be a 1/2 period for the null show up - maybe? That would be near 5.5 ms in this case. I just was assuming that the wavelet math algorithm may place them at 0 ms. I hope John or Matt, or others who understand this better than I, can help explain.
 

ReDRuM

Registered
Thread Starter
Joined
Aug 14, 2017
Messages
16
as I do not understand your comment.

EDIT: Ignore, wrong! :)

I think my sentence came out more complicated than necessary :)

My point is simply this:

If the offending reflection happens too soon, it is impossible for the algorithm to place it *exactly* where it should be on the time axis. In your SBIR example - 5.5 ms. So it shows up at 0 ms.

The "too soon" parameter is defined as "1/T", and is frequency dependent. From REW help: "In general, if the length of signal we analyze is T seconds, the lowest frequency is 1/T - so if our window was only 3ms long, the frequency response would only go down to 1/0.003 = 333Hz".

I interpret this like this: If 1/T determines the "lower bound for a valid response" (as John wrote above), then, if a reflection-caused dip happens sooner than 1/T, it is placed at 0 ms. Which is (I think) in line with what you explained.
 
Last edited:

ReDRuM

Registered
Thread Starter
Joined
Aug 14, 2017
Messages
16
EDIT: Ignore, wrong!

Obviously, the measurement for my R speaker shows otherwise... It clearly shows the reflection happening at 5 ms, when, by the logic above, everything under one period should be at 0 ms. In this case, for 100 Hz, one period is 10 ms.

But in all my other measurements the logic follows, so I'll just write this one off as an anomaly :) The REW manual also states that it is not able to pinpoint reflections exactly, if they happen sooner than 1/T (one period).

Would love to hear what John thinks, and clear up the (my) confusion :)
 
Last edited:

jtalden

Senior Member
Joined
May 22, 2017
Messages
888
Location
Arizona, USA
More  
Preamp, Processor or Receiver
Marantz AV7705 Pre/Pro
Main Amp
VTV 6 chnl NC252MP P-amp x 2
Additional Amp
Behringer DCX2496 x 2
Universal / Blu-ray / CD Player
OPPO BDP-103 Universal Player
Front Speakers
DIY SEAS H1456/H1212 Spkr x 5
Subwoofers
DIY JBL 2235H 15" SW x 2
Video Display Device
JVC DLA-X790R
Screen
Da-Lite Da-Snap 39105V - 92"
Hmm.. What are the mains? They go very low. If they have an XO at 100 Hz then the timing of that handoff may be a contributor to this result.
 

ReDRuM

Registered
Thread Starter
Joined
Aug 14, 2017
Messages
16
The measurements labeled as "R" and "L" are the mains, full range, no cutoff. Adams S3A
 

ReDRuM

Registered
Thread Starter
Joined
Aug 14, 2017
Messages
16
I think we (at least I have) might be reading too much into the spectrogram. From your first spectrogram message:

The null at ~80 Hz appears at ~32 ms. This can be easily seen on the spectrogram.

View attachment 8714

The blue area you have marked is not a "null"... It is simply the point in time where that particular frequency has decayed completely. The spectrogram is basically just a different view of the waterfall / decay graph.

Reflection vs. non-reflection:

2 R Spectrogram.jpg

Would a null-causing reflection even show up on a spectrogram??? John?

I take back all the mumbo-jumbo regarding lower frequency limits, 1/T and the spectrogram... Sorry about that. I'm learning :greengrin:
 

jtalden

Senior Member
Joined
May 22, 2017
Messages
888
Location
Arizona, USA
More  
Preamp, Processor or Receiver
Marantz AV7705 Pre/Pro
Main Amp
VTV 6 chnl NC252MP P-amp x 2
Additional Amp
Behringer DCX2496 x 2
Universal / Blu-ray / CD Player
OPPO BDP-103 Universal Player
Front Speakers
DIY SEAS H1456/H1212 Spkr x 5
Subwoofers
DIY JBL 2235H 15" SW x 2
Video Display Device
JVC DLA-X790R
Screen
Da-Lite Da-Snap 39105V - 92"
I'm only learning too. I only pointed out the 'hole' on the wavelet chart in case it helped with your analysis.
Possibly my references to 'null' and 'room mode' implied I was promoting it as such? Should it be referred to as a zero to imply it's an SBIR related effect? I don't even know the correct terminology and
was not trying to assign it to one cause or another. I don't know enough for that.

This just reaffirms my initial suggestion that my comments are more reliable when related to the impact of windowing on the charts and to time alignment of drivers. Room response analysis is still a major weakness for me.:)
 

ReDRuM

Registered
Thread Starter
Joined
Aug 14, 2017
Messages
16
Possibly my references to 'null' and 'room mode' implied I was promoting it as such? Should it be referred to as a zero to imply it's an SBIR related effect?


It's neither really! The spectrogram is the same as a waterfall graph, but viewed from above. So in other words, the "hole" you are mentioning simply denotes that the frequency in question has decayed completely by that time. That's it.

This just reaffirms my initial suggestion that my comments are more reliable when related to the impact of windowing on the charts and to time alignment of drivers. Room response analysis is still a major weakness for me.:)

Ha, no worries, your comments regarding alignment have been bookmarked :greengrin:
 

Matthew J Poes

AV Addict
Joined
Oct 18, 2017
Messages
1,903

It's neither really! The spectrogram is the same as a waterfall graph, but viewed from above. So in other words, the "hole" you are mentioning simply denotes that the frequency in question has decayed completely by that time. That's it.


Ha, no worries, your comments regarding alignment have been bookmarked :greengrin:

Just note that for a spectrogram using FFT they are showing the exact same information as a waterfall using the exact same method of analysis, basically. For Wavelet this is not true and the resolution is typically higher. I still don't see a value in waterfall plots nor FFT spectrograms. I have found value in wavelet analysis as of late, as it helps pick up reflections that are more subtle in the steady-state response (or in some cases not visible if at high frequencies).
 
Top Bottom