AudiocRaver
Loved and Remembered Emeritus Reviewer
More
- Preamp, Processor or Receiver
- Onkyo TX-SR705 Receiver
- Main Amp
- Crown XLS 1502 DriveCore-2 (x2 as monoblock)
- Additional Amp
- Behringer A500 Reference Power Amplifier
- Front Speakers
- MartinLogan Electromotion ESL Electrostatic (x2)
- Center Channel Speaker
- Phantom Center
- Surround Speakers
- NSM Audio Model 5 2-Way (x2)
- Subwoofers
- JBL ES150P Powered Subwoofer (x2)
The music need not e chosen at random, I see no benefit in that.
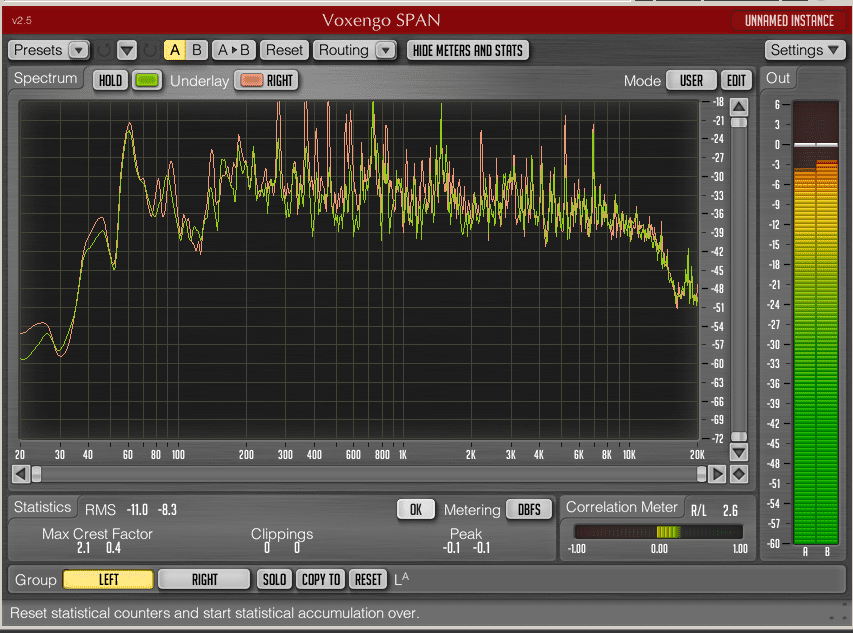
Here is a spectrum analysis snapshot of Burn The Witch by Radiohead, a song I might listen to any day of the week. Might as well use a real example. I do not listen to average music, I listen to specific songs.
Full spectrum, a fairly even distribution of energy with no shortage of upper mids and highs. The rms signal levels are -11 dBFS left and -8.3 dBFS right.
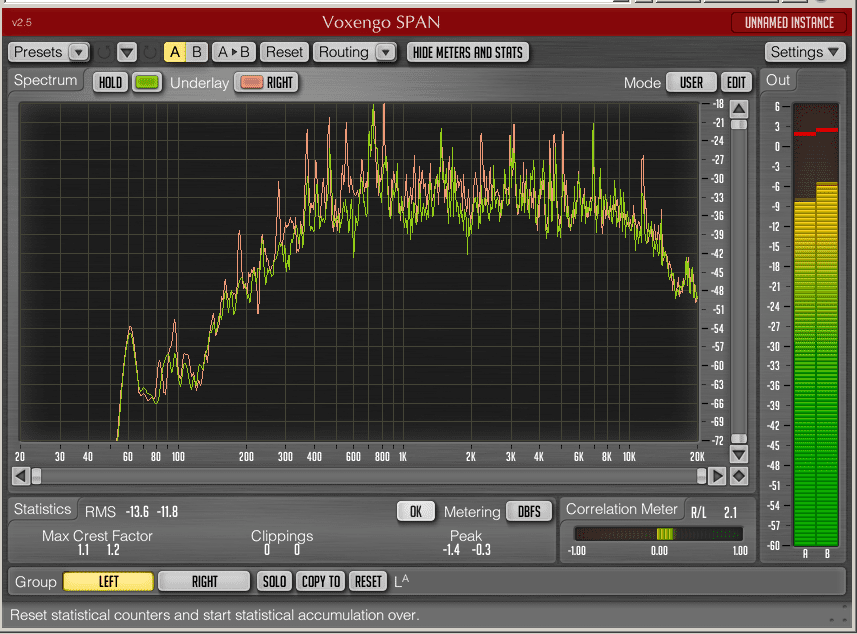
Same passage, but with a 12 dB/oct high-pass filter at 500 Hz. The rms signal levels have only dropped to -13.6 dBFS and -11.8 dBFS, a difference of 2.6 and 3.5 dB respectively, indicating that MF and HF energy accounts for about half of the energy of the track at that point in time.
Here is a spectrum analysis snapshot of Burn The Witch by Radiohead, a song I might listen to any day of the week. Might as well use a real example. I do not listen to average music, I listen to specific songs.
Full spectrum, a fairly even distribution of energy with no shortage of upper mids and highs. The rms signal levels are -11 dBFS left and -8.3 dBFS right.
Same passage, but with a 12 dB/oct high-pass filter at 500 Hz. The rms signal levels have only dropped to -13.6 dBFS and -11.8 dBFS, a difference of 2.6 and 3.5 dB respectively, indicating that MF and HF energy accounts for about half of the energy of the track at that point in time.