Group Excess Delay plot interpretation?

andyr

Registered
Thread Starter
Joined
Sep 9, 2017
Messages
24
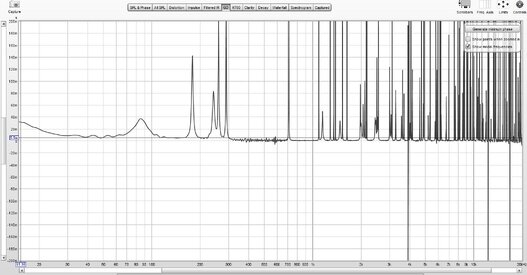
My Excess Group Delay plot is shown below (no smoothing).

I'd appreciate someone telling me whether or not I'm interpreting it correctly. :):

* I have a 24dB LP/HP XO between subs and woofers at 100Hz; the (shallower) XO between woofer and mid is 300Hz. There's another XO between mids and tweeters at ~4kHz.
* the graph shows that either side of 100Hz, the bottom of the plot is at the same level - I'm assuming this signifies that I have applied the correct delay, in my miniDSP plug-in, to the mains ... vs. the subs.
* likewise the graph either side of the mid-tweeter XO (~4kHz) is at the same level (0ms delay).
* however, the graph shows that the subs & woofers are 5ms delayed, compared to the mids & tweeters. (There's a discontinuity at 300Hz.)

Does this discontinuity mean that I should apply a 5ms delay to the mids and tweeters, to "line them up" with the woofers and subs?


Thanks,
Andy
 

Attachments

  • Jul 15 Excess Delay - no smoothing.JPG
    Jul 15 Excess Delay - no smoothing.JPG
    139.7 KB · Views: 142

andyr

Registered
Thread Starter
Joined
Sep 9, 2017
Messages
24
That's what it looks like, yes. You can apply a frequency-dependent window to remove the high frequency reflections by the way, and clean up the plot. Another useful view for time alignment is the wavelet spectrogram.

Great - thanks for the confirmation, John. :T

I'll come back to you about:
* a 'frequency-dependent window', and
* the 'wavelet spectrogram'

... when I've researched them. :)


Andy
 

andyr

Registered
Thread Starter
Joined
Sep 9, 2017
Messages
24
OK, John - have had several days of playing around with my miniDSP settings and REW.

The first attachment is the EGD plot with the delays I had on Jul 26 - with frequency dependent windows applied. It's not exactly the same as the EGD plot from the other day - but I have changed some miniDSP PEQ settings in the last few days! :)

But it does still show that the subs (whose LP filter is 24dB @ 100Hz) are delayed, compared to the main speakers:


EGD Plot Aug 20 6dB mid HP.jpg


I was able to add an additional 6ms of delay to the 3 drivers in the main speakers, to see whether this would line up the subs with the main spkrs. The 2nd attachment is the EGD plot resulting from this:


EGD Plot Aug 20 6dB mid HP with 15ms delays.jpg


Looking at this graph:
* yes, it has lined up the main spkrs with the subs - except I should probably reduce the delay on the woofers by, say, 2ms.
* however, I now have:
- a large positive spike in group delay centred on 80Hz (there is no EQ applied at this frequency), and
- 2x very narrow negative spikes at about 180Hz & 390 Hz.(there is +ve EQ applied at 175Hz & 400Hz).

Do these spikes in the EGD plot show that it is a worse configuration than my first one?

Andy
 

John Mulcahy

REW Author
Joined
Apr 3, 2017
Messages
7,289
No, those will usually be effects from room resonances and reflections, though the spikes would normally be positive. Where you get sharp changes there is typically a notch in the response due to a partial cancellation. It is not a good idea to try and EQ those, they are very dependent on location so the response can be very different a short distance away. EQ is best kept below about 200 Hz unless it is very broad (i.e. more of a tone control). Narrow boost filters should be avoided.
 

andyr

Registered
Thread Starter
Joined
Sep 9, 2017
Messages
24
No, those will usually be effects from room resonances and reflections, though the spikes would normally be positive. Where you get sharp changes there is typically a notch in the response due to a partial cancellation. It is not a good idea to try and EQ those, they are very dependent on location so the response can be very different a short distance away. EQ is best kept below about 200 Hz unless it is very broad (i.e. more of a tone control). Narrow boost filters should be avoided.

Hi John,

The sharp negative spikes I can understand are merely artefacts; I have not used EQ at those frequencies.

However, it's the spike @ 80Hz which concerns me (in terms of "is this bad for the actual sound?"):
* why should changing the delay between subs and main speakers have caused this?
* surely this spike in EGD @ 80Hz cannot be a good thing?

Andy
 

John Mulcahy

REW Author
Joined
Apr 3, 2017
Messages
7,289
The group delay plot is handy for checking time alignment. It shouldn't be your main focus, nor should it be used as a proxy for response quality. Better devoting your attention to the frequency response.
 

andyr

Registered
Thread Starter
Joined
Sep 9, 2017
Messages
24
The group delay plot is handy for checking time alignment. It shouldn't be your main focus, nor should it be used as a proxy for response quality. Better devoting your attention to the frequency response.

Aah, thanks, John.

Andy
 

andyr

Registered
Thread Starter
Joined
Sep 9, 2017
Messages
24
An update. I had friends around on Wednesday who know my system well, for a listening session.

We listened to:
1. the config with the delays I had been listening to (with the Maggie drivers delayed by 9ms,whose EGD plot is the 1st one shown in post #4)
2. and then with the Maggie drivers delayed by 15ms - with the EGD plot which is the 2nd one shown in post #4.

Interestingly enough, we all thought #1 sounded better. The sound became 'flat and lifeless' with config #2.

So I will leave the delays as they were! :)

Andy
 
Top Bottom