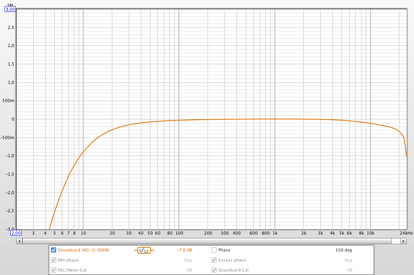
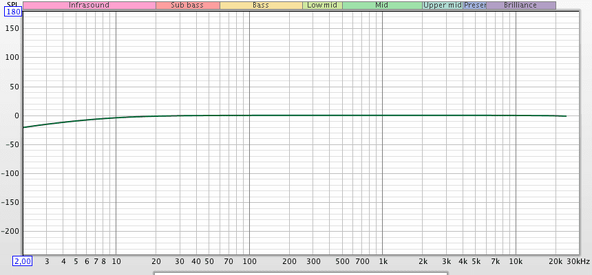
I don’t understand what’s the matter, I changed some settings in the measurement display graph and now all the measurements have become strange, how to return them to their original state. In the screenshots of how it was and how it became, you need to do it as it was. Tell me what to fix in the settings


Graph (SPL&Phase)
- Thread starter maximm
- Start date


Popular tags
20th century fox
4k blu-ray
4k uhd
4k ultrahd
action
adventure
animated
animation
bass
blu-ray
calibration
comedy
comics
denon
dirac
dirac live
disney
dolby atmos
drama
fantasy
hdmi 2.1
home theater
horror
kaleidescape
klipsch
lionsgate
marantz
movies
onkyo
paramount
pioneer
rew
romance
sci-fi
scream factory
shout factory
sony
stormaudio
subwoofer
svs
terror
thriller
uhd
ultrahd
ultrahd 4k
universal
value electronics
warner
warner brothers
well go usa