A few feature requests

napilopez

Registered
Thread Starter
Joined
Dec 8, 2018
Messages
2
First of all, just wanted to say thanks for all your hard work John.

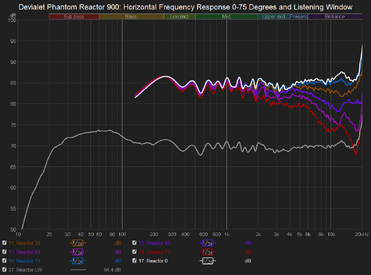
I'm probably not the typical REW user, but I use the software a lot to perform quasi-anechoic speaker measurements and data presentation.Though there is no dire need, I thought I'd voice some features that could really help me and others doing similar. They're in rough order of preference:
  • Truncate a frequency response: When gating frequency response measurements, the data becomes less accurate in the low bass. I'd like to be able to truncate the graph at a given frequency - or perhaps use a dotted line to denote the innaccurate region. Currently I do this by exporting the files to text and deleting the content before the specified frequency. it works, but it's a bit cumbersome when you have dozens of measurements to work with =]. I noticed I can also do this by limiting the left window of time measurements, but the frequency it cuts off isn't always where I'd like to cut off the graph.
  • Use dotted/dashed curves: I really appreciated when this was added to monocrome captures, but it would actually be super handy for data presentation purposes to be able to use this on color curves as well! (Also helps for visibility for people with colorblindness).
  • Multiple SPL offset - sometimes for data presentation purposes I might move several curves up or down at once. Perhaps under the "actions for all selected measurements, we can have an option to offset all the curves by a certain amount?
  • Weighted averages: Again, a pretty niche use that there are other tools for, but with more people using REW for speaker measurements, it could be useful. Computing some graphs (i.e. for spinorama/cta-2034-a) requires performing weighted averages. It'd be cool with we could input weighting values right in REW.
  • Blended merge function: When splicing nearfield bass measurements and gated high frequency measurements, I use the merge function. It would be awesome if I could splice curves with a smoother transition. I can use other tools for this, but figure I'd ask =]
I appreciate you hearing me out - just some things to maybe consider for down the road. Thank you so much!
 
Last edited:

John Mulcahy

REW Author
Joined
Apr 3, 2017
Messages
7,297
Truncate a frequency response: When gating frequency response measurements, the data becomes less accurate in the low bass. I'd like to be able to truncate the graph at a given frequency - or perhaps use a dotted line to denote the innaccurate region. Currently I do this by exporting the files to text and deleting the content before the specified frequency. it works, but it's a bit cumbersome when you have dozens of measurements to work with =]. I noticed I can also do this by limiting the left window of time measurements, but the frequency it cuts off isn't always where I'd like to cut off the graph.
That exists already, and there is an Analysis preference to decide whether to cur the response off below the minimum valid frequency or show it dashed. It is currently based on the total window width though, I have added another Analysis preference (selected by default) to use only the right hand IR window width when deciding the minimum valid frequency, which is usually the appropriate choice provided the reference time for the IR window is at or near the IR peak or the IR start.

Use dotted/dashed curves: I really appreciated when this was added to monocrome captures, but it would actually be super handy for data presentation purposes to be able to use this on color curves as well! (Also helps for visibility for people with colorblindness).
That is probably most relevant on the various overlay graphs, so I have added a "Use dashed traces on overlays" View preference to use different line styles as well as different colours on those graphs. There are only 4 line styles so it helps to retain the different colours.

Multiple SPL offset - sometimes for data presentation purposes I might move several curves up or down at once. Perhaps under the "actions for all selected measurements, we can have an option to offset all the curves by a certain amount?
There is already an item on the todo list for that.

Weighted averages: Again, a pretty niche use that there are other tools for, but with more people using REW for speaker measurements, it could be useful. Computing some graphs (i.e. for spinorama/cta-2034-a) requires performing weighted averages. It'd be cool with we could input weighting values right in REW.
Perhaps a little awkward to implement in the UI, but I'll add it to the todo list.

Blended merge function: When splicing nearfield bass measurements and gated high frequency measurements, I use the merge function. It would be awesome if I could splice curves with a smoother transition. I can use other tools for this, but figure I'd ask =]
I have added a check box on the merge operation to optionally blend the merge over 1/3 octave either side of the merge frequency.
 

napilopez

Registered
Thread Starter
Joined
Dec 8, 2018
Messages
2
That exists already, and there is an Analysis preference to decide whether to cur the response off below the minimum valid frequency or show it dashed. It is currently based on the total window width though, I have added another Analysis preference (selected by default) to use only the right hand IR window width when deciding the minimum valid frequency, which is usually the appropriate choice provided the reference time for the IR window is at or near the IR peak or the IR start.

That is probably most relevant on the various overlay graphs, so I have added a "Use dashed traces on overlays" View preference to use different line styles as well as different colours on those graphs. There are only 4 line styles so it helps to retain the different colours.

There is already an item on the todo list for that.

Perhaps a little awkward to implement in the UI, but I'll add it to the todo list.

I have added a check box on the merge operation to optionally blend the merge over 1/3 octave either side of the merge frequency.

Thank you so much for hearing me out, and so quickly!

On truncating measurements, I appreciate you adding the option to do so via right window width, this will be a great time saver. And I'd actually mentioned being aware of doing so via the left window window width =] But here are some reasons I don't always like to do this is and there are times truncating at a "manually" selected frequency could be useful:
  • Though usually, the window method works well, sometimes the data starts to look weird in the 100Hz or so before the window-based cut-off. Note how in this set of on-and-off axis measurements, for one example, the bass starts to dip in a way that's present in neither the spliced curved nor spatially averaged in-room measurements.
    28328

    Don't know if that's because of user error or what, but I was not able to remove this dip with repeeat measurements and adjuting my setup. I could truncate this region by making the time window smaller, but then this would remove even more resolution from the already sparse low frequency data.
  • I can't manipulate the IR windows of averaged responses.
  • I also can't do so for imported SPL graphs that do not have phase information, say, if I only want to show part of the data.
  • Sometimes I want to show only the bass and ignore HF data.
Truncating via time windowing has me covered most of the time, so I appreciate your efforts there. Just thought I'd explain a few special cases.

Thank you again!
 

Attachments

  • Reactor Horizontal Response.png
    Reactor Horizontal Response.png
    39.5 KB · Views: 5
Top Bottom