


-
AUDIO VIDEO PROCESSING, SETUP & ENVIRONMENTOfficial REW (Room EQ Wizard) Support Forum Audiolense User Forum Calibration Equipment Auto-EQ Platforms / Immersive Audio Codecs Video Display Technologies / Calibration AV System Setup and Support Listening Room / Home Theater Build Projects Room Acoustics and Treatments AV Showcase Movies / Music / TV / Streaming
-
AUDIO VIDEO DISCUSSION / EQUIPMENTHome Theater / Audio and Video - Misc Topics Essence For Hi Res Audio AV Equipment Advice and Pricing Awesome Deals and Budget AV Equipment AV Receivers / Processors / Amps UHD / Blu-ray / CD Players / Streaming Devices Two Channel Hi-Fi Equipment DIY Audio Projects Computer Systems - HTPC / Gaming HD and UHD Flat Screen Displays Projectors and Projection Screens AV Accessories Buy - Sell - Trade
Navigation
Install the app
How to install the app on iOS
Follow along with the video below to see how to install our site as a web app on your home screen.
Note: This feature may not be available in some browsers.
More options
You are using an out of date browser. It may not display this or other websites correctly.
You should upgrade or use an alternative browser.
You should upgrade or use an alternative browser.
Distorsions...
- Thread starter GOULAS
- Start date


John Mulcahy
REW Author
- Joined
- Apr 3, 2017
- Posts
- 9,069
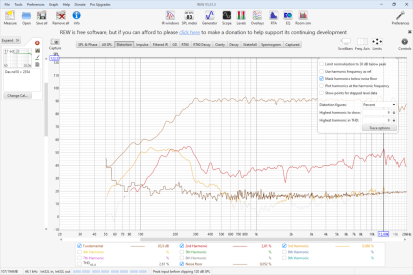
Probably because the reference is the harmonic frequency. The 2nd harmonic reference is at 25.2 kHz which is likely after your measurement rolls off so the fundamental there is very low. You can choose whether or not to use the harmonic frequency as the reference in the graph controls, the help explains why that may be helpful.
John Mulcahy
REW Author
- Joined
- Apr 3, 2017
- Posts
- 9,069
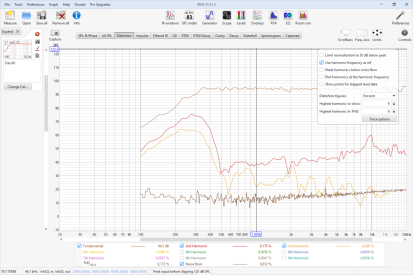
Plot harmonics at the harmonic frequency changes the way the harmonic orders for sweep measurement distortion are plotted - rather than plotting the distortion at the frequency of the fundamental it is plotted at the frequency of the harmonic, so (for example) the 2nd order harmonic distortion level for 1 kHz would be plotted at 2 kHz, where the distortion occurs. This makes it easier to correlate harmonic levels with the level of the fundamental at the harmonic frequency and also helps distinguish the effects of external noise, since noise affects all harmonics at the frequency at which it occurs. The THD trace is not affected by this control, it will continue to show the THD value corresponding to the harmonic levels at their fundamental frequency. However, when plotting harmonics at the harmonic frequency the level of the fundamental at the harmonic frequency (which in this graph mode is the cursor frequency) is used as the reference, so Use harmonic frequency as ref will be selected and the control for it disabled. If that was not previously selected the THD trace will update.
John Mulcahy
REW Author
- Joined
- Apr 3, 2017
- Posts
- 9,069
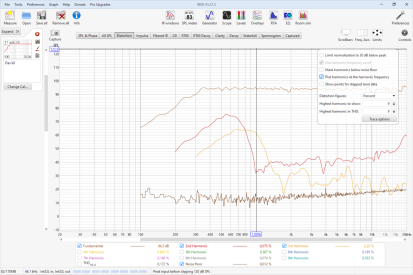
In the second case you would need to move the cursor to 2 kHz to see the 2nd harmonic level for 1 kHz fundamental, 3 kHz for the 3rd etc.
John Mulcahy
REW Author
- Joined
- Apr 3, 2017
- Posts
- 9,069
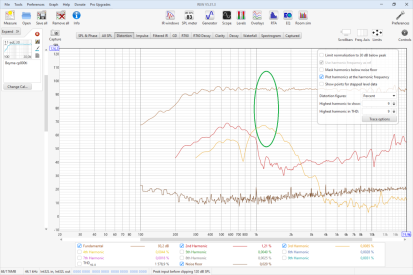
If you choose "Plot harmonics at the harmonic frequency" then the 3rd harmonic of 1 kHz will be plotted at 3 kHz. The whole 3rd harmonic graph is shifted 3 times higher in frequency than when you do not select that option. The graph legend show figures for the cursor position, so if you have "Plot harmonics at the harmonic frequency" selected and the cursor is at 1 kHz the 2nd harmonic figure will be for 500 Hz and the 3rd harmonic will be for 333.3 Hz. Don't use "Plot harmonics at the harmonic frequency" unless you have some specific need to do that.


Popular tags
20th century fox
4k blu-ray
4k uhd
4k ultrahd
action
adventure
animated
animation
bass
blu-ray
calibration
comedy
comics
denon
dirac
dirac live
disney
dolby atmos
drama
fantasy
hdmi 2.1
home theater
horror
kaleidescape
klipsch
lionsgate
marantz
movies
onkyo
paramount
pioneer
rew
romance
sci-fi
scream factory
shout factory
sony
stormaudio
subwoofer
svs
terror
thriller
uhd
ultrahd
ultrahd 4k
universal
value electronics
warner
warner brothers
well go usa