


Hello,
I have looked through the manual and forum but not found anything addressing the following.
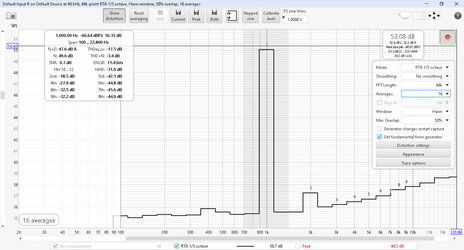
The issue is in RTA mode if you look at the Harmonic Distortion levels in dB they do not correlate at all with the levels of those harmonics shown in the graph. We are currently using 5.30.9 but have also tried 5.20 and found the same issue.
The data in the table below comes from the attached RTA screen grab with a 1kHz sine wave. As you can see, a) the differences between primary and harmonic levels shown in the RTA and THD panel are completely different and b) the differences shown between the RTA harmonics are very small but all over the place in the THD panel data.
Best Regards,
Pschnob
I have looked through the manual and forum but not found anything addressing the following.
The issue is in RTA mode if you look at the Harmonic Distortion levels in dB they do not correlate at all with the levels of those harmonics shown in the graph. We are currently using 5.30.9 but have also tried 5.20 and found the same issue.
The data in the table below comes from the attached RTA screen grab with a 1kHz sine wave. As you can see, a) the differences between primary and harmonic levels shown in the RTA and THD panel are completely different and b) the differences shown between the RTA harmonics are very small but all over the place in the THD panel data.
Best Regards,
Pschnob
| RTA graph SPL dB data | Difference between primary and harmonic levels | THD panel dB data | |
| primary | 50 | ||
| 2nd | 37.5 | -12.5 | -18.5 |
| 3rd | 36.5 | -13.5 | -42.1 |
| 4th | 36.7 | -13.3 | -27.9 |
| 5th | 36.9 | -13.1 | -44.8 |
| 6th | 37 | -13 | -32.5 |
| 7th | 37.5 | -12.5 | -45.6 |
| 8th | 37.5 | -12.5 | -32.2 |
| 9th | 37.9 | -12.1 | -44.9 |
Attachments
Last edited:


