-
-
Xxiao posted the thread The principle of the impulse response time window is? in Official REW (Room EQ Wizard) Support Forum.Hi,John Mulcahy. sweep 20 to 20000 Hz for 5.9 seconds. a 20 Hz sound is emitted at 0 seconds, but the 20000 Hz sound doesn't emit...
-
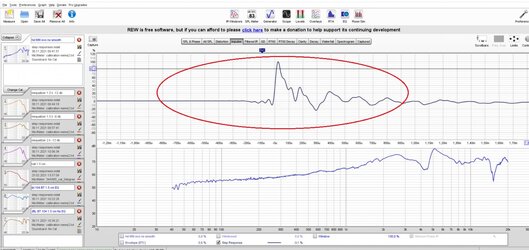
Xxiao posted the thread Is this a step response curve? in Official REW (Room EQ Wizard) Support Forum.Is the plot in the picture a step response curve? This is how it's measured? Could you please explain the detailed steps, thank you.
-
-
-
Loading…
-
Loading…