Presentation and paste graphics problem

Mlupo

Registered
Thread Starter
Joined
Mar 29, 2019
Messages
4
Dear all,

I am a new, just signed, member from Italy. Hello to everyone.

Not only because of my age (I have already seen a relevant number of Springs) I am attracted by vintage equipment. It is not only because of my age, being in fact attracted by them since young (one of my past interests has been collecting and restoring old radio sets).

Well, I have seven Hi-Fi systems at home, all them based on vintage gears.

I am particularly attracted by old speakers and turntables.

Well, I am not a skilled technician, I mean I do not have the knowledge to design myself a speaker system from the draft. My approach has always been that it is not useful to me to know the performance of a speaker in the anechoic room, what is important to me is to know what is reaching my ears in a listening position, (of course while hearing a decent speaker) so I can see what happens by changing the placement of the speakers, listening position, and so on.

I know it is a limited approach but as said my need is not to design or improve a speaker, it is just to how get the best from it.

I have found recently REW, downloaded it, bought a Behringer ECM800 microphone, and a U-Phoria UMC202HD Audio interface/preamplifier and WOW, fantastic! Thank you! That is all I need and even much more.

I have then restored an old ESL loudspeaker system by Audiostatic, and got a lot of satisfaction in taking various graphs.

I have a silly problem now, that I have not been able to solve.

How can mix graphs from different files?

I mean, I have saved a graph with let say three different curves, let call graph A, and another graph with let say four curves, let call it graph B.

I am not able to take the curve from one of them and paste it in the other graph.

I am not able to upload graph A and graph B at the same time, only one at once.

I believe that it should be possible, but I have not found how.

Thank you in advance for your help.

Kind regards

Giovanni
 

John Mulcahy

REW Author
Joined
Apr 3, 2017
Messages
7,296
Hi Giovanni,

To clear up some terminology, REW mdat files can contain multiple measurements, and multiple mdat files can be loaded at once. Measurements can be saved individually, one measurement in one mdat file, by pressing the save button on that measurement. Save All makes an mdat file with all the current measurements in it.

The main REW window shows a single measurement at a time, apart from the All SPL graph which shows all the measurements. There is a button in the toolbar called "Overlays" which opens a new window with various types of graph that show all measurements, or whichever ones are selected in the graph legend.

Does any of that help with what you want to do?
 

Mlupo

Registered
Thread Starter
Joined
Mar 29, 2019
Messages
4
Dear John,

thank you very much but trying what you suggested has not solved my problem. Probably I have not been clear. Let try again, please be patient.

I have measured the left speaker at one-meter distance, made the graph of it. Then I did a new measure in the same REW’ session, measuring the right channel speker at one meter. Then I did measure noth speakers at the listening position. So I have a window with the three graphs and I have saved them with the Save all button, naming the file “Speakers A” and closing the session.

Then I start a new session, doing the same with another set of speakers, hence saving a new Save all file, named “Speakers B”

Now, what I would like to do is to take the single graph of the listening position of the speakers A and the single graph of the listening position of the speakers B, without the other graphs, together in a single window so I can directly compare the differences.

I am not able to do that. I can upload the file “Speaker A” and then delete the two curves taken at one meter, remaining with the single one taken in the listening position, but then I can’t upload the same graph from the other file. If I click the “Open” button and choose the “Speaker B” file, I have only that file, and the previous “Speaker A” file disappear.

By clicking on the Overlay button I access a new window with the same graphs of the opened file, I have no access to another file.

To make it simple, it is not impossible to import a graph from a file into another file.

Or if you wish, paste graphs from different files.

Kind regards

Giovanni
 

John Mulcahy

REW Author
Joined
Apr 3, 2017
Messages
7,296
I am not able to do that. I can upload the file “Speaker A” and then delete the two curves taken at one meter, remaining with the single one taken in the listening position, but then I can’t upload the same graph from the other file. If I click the “Open” button and choose the “Speaker B” file, I have only that file, and the previous “Speaker A” file disappear.
I don't understand how or why a measurement could disappear when you open another measurement. I am probably not understanding what you mean by "disappear".

These are the measurements:

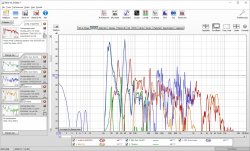
measurementspanel.jpg


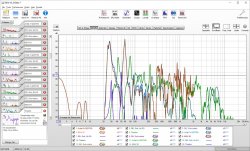
One measurement is selected at a time. When selected the graphs for that measurement appear in the main REW window, to the right of the measurements. There is one graph in the main window that shows all the measurements currently loaded, called "All SPL". Here is an example:

allspl.jpg

To show or hide individual measurements in that graph just select or unselect them in the legend:

legend.jpg

The Overlays window shows all current measurements, you choose which ones you want by selecting them in the legend, same as for the All SPL graph.

You can open as many files as you like in REW, they all appear in the list of measurements. Here I have opened the same file 3 times just for illustration, so you see 3 copies of each of the 5 measurements in that file.
allsplx3.jpg

If you are finding something different happens perhaps you could capture some screenshots to explain what you are seeing.
 

Mlupo

Registered
Thread Starter
Joined
Mar 29, 2019
Messages
4
Dear John,
it is matter of using the same therms for understanding each other, sorry for my bad English; so now let call "measurement" the curves on the left of the main window.
What I am not able to do is exactly what you did in your last example: "You can open as many files as you like in REW, they all appear in the list of measurements. Here I have opened the same file 3 times just for illustration, so you see 3 copies of each of the 5 measurements in that file.": how do you do that?
If I open one file, with let say three measurements, and then I want to open another file which has four measurement, which is the procedure?
I thought that it could just be possible by clicking on the "Open" button, but it doesn't work like that. If I open one file, and then I try to open another file, I do not see the first one anymore. It disappear, I only see the latest file and not the previous one.
Please can you tell me step by step how you did open the same file three times?
Thank you for being patient.
Kind regards
Giovanni
 

John Mulcahy

REW Author
Joined
Apr 3, 2017
Messages
7,296
Just clicking the open button and selecting the file, nothing else. Or you can do File -> Open from the menu, or File and select the file name from the list of the last 10 files that were opened. They all do the same thing, and none of them remove any existing measurements.

Which version of REW are you running and on what operating system?
 

Mlupo

Registered
Thread Starter
Joined
Mar 29, 2019
Messages
4
Dear John, SORRY! Forget it, stupid me! I didn't realize that the measurements were increasing on the left panel.
It works perfectly, sorry for all the troubles and thank you for your patience.
Kind regards
Giovanni
 
Top Bottom