
JuiceBox1111
Registered
Thread Starter
- Joined
- May 3, 2018
- Messages
- 1
More
- Preamp, Processor or Receiver
- Focusrite Sapphire Pro24 DSP
- Main Amp
- VOXAC30 :)
- Front Speakers
- Genelec 1031A
Hello all,
Total noob here. Help me understand these measurements. I'm unsure either how these frequency curves could help me either apply correct EQ in my DAW to compensate for my room (is that even something people do?), and am similarly unsure how to move forward with room treatment. I'm fairly certain I did the measurements correctly. Not sure if I should have applied EQ, or why it is important in regards to a raw measurement. If there's another way, please correct me. What exactly should I be looking for in these graphs? Also, I'd appreciate any recommendations about speaker placement (I know my room is a terrible mixing environment) or any other quick and dirty room related fixes.
Output device: Focusrite Sapphire Pro DSP 24
Soundcard calibration: Done from Sapphire Pro headphone output to Macbook Pro line inputs.
SPL meter calibration and measurement: Done with RadioShack C-weighted SPL meter going RCA-->1/8'' into Macbook Pro line input (SPDIF input of Sapphire didnt pick up a signal from the radioshack RCA outs, otherwise I would have done that)
Default EQ selected: DSP1124P/FQB1000
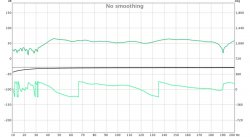
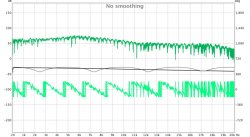
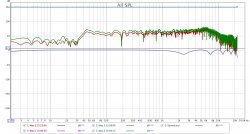
Red line= 1M sweep || Green Line = 256k sweep || black = soundcard calibration

10-200Hz close up:

1k-20k sweep close-up:
My room/home studio:


20180503_144918.jpg
Thanks in advance for all the insight,
PJ
Total noob here. Help me understand these measurements. I'm unsure either how these frequency curves could help me either apply correct EQ in my DAW to compensate for my room (is that even something people do?), and am similarly unsure how to move forward with room treatment. I'm fairly certain I did the measurements correctly. Not sure if I should have applied EQ, or why it is important in regards to a raw measurement. If there's another way, please correct me. What exactly should I be looking for in these graphs? Also, I'd appreciate any recommendations about speaker placement (I know my room is a terrible mixing environment) or any other quick and dirty room related fixes.
Output device: Focusrite Sapphire Pro DSP 24
Soundcard calibration: Done from Sapphire Pro headphone output to Macbook Pro line inputs.
SPL meter calibration and measurement: Done with RadioShack C-weighted SPL meter going RCA-->1/8'' into Macbook Pro line input (SPDIF input of Sapphire didnt pick up a signal from the radioshack RCA outs, otherwise I would have done that)
Default EQ selected: DSP1124P/FQB1000
Red line= 1M sweep || Green Line = 256k sweep || black = soundcard calibration
10-200Hz close up:
1k-20k sweep close-up:
My room/home studio:
20180503_144918.jpg
Thanks in advance for all the insight,
PJ