RT60 Reverberation Time Measurement Variations

Chris Lineau

Registered
Thread Starter
Joined
Jan 11, 2018
Messages
10
Location
Germany
Hi guys,

first of all hello to all of you! I think it is great we have such a platform here to discuss REW!

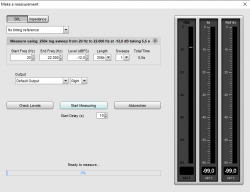
I managed to successfully install and calibrate REW and all SPL graphs look fine and are approx. the same no matter how often I measure, but when I want to measure the RT60 I have big problems:

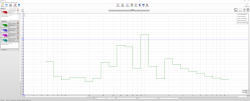
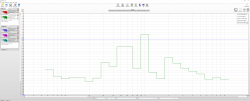
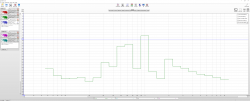
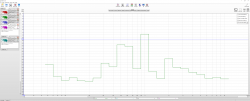
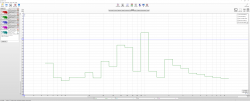
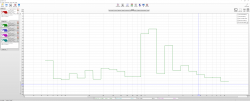
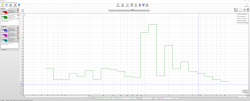
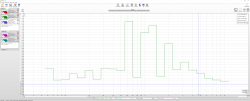
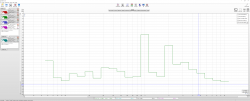
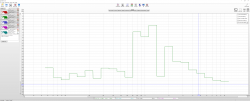
- Unreliable decay time measurements: for instance, when I look at "Topt", the decay times measured per 1/3 octave band vary a lot per measurement! For the same octave band they are sometimes approx. 0,5 s and sometimes 1 s!

- When acousticians are talking about the "decay time RT60", which of the different REW values ("T20", "T30", "EDT", or "Topt") do they mean?

Can you guys help me out here?

Kind regards and thanks a lot for your time,
Chris
 
Last edited:

John Mulcahy

REW Author
Joined
Apr 3, 2017
Messages
7,289
All are estimates of the RT60 time, they differ in which part of the Schroeder integral they use to make the estimate - the help explains.

Regarding your inconsistent results, best posting some example mdat files showing that.
 

Chris Lineau

Registered
Thread Starter
Joined
Jan 11, 2018
Messages
10
Location
Germany
Hello John,

thanks for your reply!

I made some measurements today and I changed two things:

- I turned up the volume knob on the back of my KRK VTX8 from -30dB to 0dB (although the SPL level at the microphone was always 75dB. Before I just cranked up my soundcard to compensate the low speaker volume)
- I switched my mobile to flight mode

The RT60 measurements per 1/3 octave band are now much less volatile! After 5 measurements each with 4 sweeps, they only differed my a max. of 0.1s and often stayed very much the same. I‘m making some more tests in the next days and then I‘ll report and again, but things looked way better today!

Kind regards,
Chris
 

Chris Lineau

Registered
Thread Starter
Joined
Jan 11, 2018
Messages
10
Location
Germany
So today, I measured again, and unfortunately, the midrange is too volatile for my taste (> 300 Hz and < 3kHZ). For instance, the 600 Hz band sometimes shows 1.3 s and sometimes around 0.3 s. This is very strange in my opinion! Could this be due to the fact that I hear flutter echoes in my room? But I don't get why the results are then so extremely deviating from each others? @John Mulcahy , what is an acceptable difference between consecutive measurements for the RT60 times per 1/3 octave band? 0.05 to 0.15 s difference between measurements? Anyways, I attach the measurement files from yesterday and today so that you can see it and also the screenshots from these measurements. Please help me!

Kind regards,
Chris
 

Attachments

  • 20180114 Measurement with speaker volume controls at 0dB.mdat
    14.2 MB · Views: 37
  • 20180115 Measurement with speaker volume controls at +6dB (default).mdat
    14.3 MB · Views: 27
  • snip_20180115161047.png
    snip_20180115161047.png
    14.2 KB · Views: 105
  • snip_20180115161328.png
    snip_20180115161328.png
    88.1 KB · Views: 108
  • snip_20180115161345.png
    snip_20180115161345.png
    95.3 KB · Views: 99
  • snip_20180115161405.png
    snip_20180115161405.png
    88.3 KB · Views: 89
  • snip_20180115161428.png
    snip_20180115161428.png
    84.8 KB · Views: 78
  • snip_20180115161438.png
    snip_20180115161438.png
    83.8 KB · Views: 68
  • snip_20180115164507.png
    snip_20180115164507.png
    86.5 KB · Views: 78
  • snip_20180115164521.png
    snip_20180115164521.png
    87 KB · Views: 76
  • snip_20180115164533.png
    snip_20180115164533.png
    87.3 KB · Views: 79
  • snip_20180115164543.png
    snip_20180115164543.png
    92.8 KB · Views: 76
  • snip_20180115164552.png
    snip_20180115164552.png
    82.3 KB · Views: 70
Last edited:

John Mulcahy

REW Author
Joined
Apr 3, 2017
Messages
7,289
It isn't necessary to use multiple sweeps, may as well use single sweeps for your measurements.

How large is the room? Your impulse responses show an odd feature after about 300 ms where there is a marked increase in energy, that is contributing to a sort of two-stage decay curve which is initially steep then slows down. That confuses the Topt measurement which looks for the most linear part of the response and can end up using varying amounts of the second stage of decay. You will get more consistent decay figures using T20 for those measurements as it only uses the initial part of the response. The variability highlights two things:

  • RT60 measurements are based on an assumption of a consistent decay (which looks linear on a log scale) which your measurements don't show, perhaps because domestic listening spaces tend to be a lot smaller than the large acoustic spaces RT60 measurements are aimed at or perhaps because there is a coupling to another space, such as a door into another room
  • Something in your system is adding significant late energy, perhaps some monitoring is active or there is some kind of processing in the signal chain or there is more than one acoustic space affecting the measurements
 

Chris Lineau

Registered
Thread Starter
Joined
Jan 11, 2018
Messages
10
Location
Germany
Hey @John Mulcahy,

thanks again for your reply. Yesterday my miniDSP Umik-1 arrived and the results were much better (results are attached)! Could be that my Behringer ECM-8000 or my Focusrite Scarlett 18i8 is broken. I also ordered a Beyerdynamic MM1 for more testing just now!

My room is 621 x 397 x 242 cm (length x width x height). Thanks for the tips regarding the amount of sweeps and the idea to use T20. I will do some more testing later! Could this "late energy" come from the flutter echoes of my untreated walls? I also have a door which is rather light than solid. Do you mean after about 300Hz? Is this a typo? What do you mean by "some monitoring going on"?

Kind regards,
Chris
 

Attachments

  • 20180115 Umik-1 Test.mdat
    12.9 MB · Views: 29
  • snip_20180115192316.png
    snip_20180115192316.png
    13.8 KB · Views: 45
  • snip_20180115192428.png
    snip_20180115192428.png
    24 KB · Views: 47

Chris Lineau

Registered
Thread Starter
Joined
Jan 11, 2018
Messages
10
Location
Germany
P.S.: I looked through the T20 measurements and they don't show the strange humps in the midrange!
 

John Mulcahy

REW Author
Joined
Apr 3, 2017
Messages
7,289
The extra energy is in the impulse response after 300 ms. By monitoring I mean some of the input signal is being fed back to the output. If tapping on the mic produces any sound at all from the speakers that indicates monitoring is active, if that happens it needs to be fixed.
 

Chris Lineau

Registered
Thread Starter
Joined
Jan 11, 2018
Messages
10
Location
Germany
Hey @John Mulcahy,

thanks for your reply. So I checked the measurements and I know what you mean in the Impulse Response window. I checked that I don't have any monitoring going on. My door to the next room and all windows are closed. Additionally, there is no unnecessary processing in the signal chain. Hence, I still don't know where this comes from! Could this come from some resonating furniture in my room? Or do you have a list of possible causes for such a late energy impulse?

Thanks for your time. I really appreciate your help!

Kind regards,
Chris
 

John Mulcahy

REW Author
Joined
Apr 3, 2017
Messages
7,289
Could be something resonating, though I wouldn't worry too much about it, it is quite a bit lower than the peak.
 

Chris Lineau

Registered
Thread Starter
Joined
Jan 11, 2018
Messages
10
Location
Germany
Okay, yes, I think I'll just look at the T20 and T30 measurements! Thank you very much for your help!
 
Top Bottom