Oh and as for measurements you should measure tust one speaker at a time and take multiples in different locations around your seating area. Average all of those and EQ. For the most part you want to apply the same EQ to each speaker. Anywhere below 200hz I would definitely apply the same EQ to each speaker based on that averaged measurement.
I'm working at integrating a biamplified system with a 1/3 octave EQ right now and also noticed that EQing to 'flat' caused the system to sound abnormally bright on most recordings. My speakers are not extremely consistent on-axis vs. off-axis, and there is definitely a change in perceived frequency response when you move the listening position slightly.
So if I understand correctly, for measurements above 200 Hz, average multiple positions for each speaker, generate an EQ for each speaker, and apply it. Then for measurements below 200 Hz, average both speakers' curves at multiple locations, then generate an EQ curve for the aggregate and apply it to both speakers? Should you be using a house curve for the recommended falling frequency response or manually apply changes to the EQ after all the measurements are completed?
I understand that not everyone will prefer the same final overall EQ curve in-room, but I'm trying to work out the best way to do this so that I don't have to re-do all the measurements if I find that a 'house curve' (or whatever you would call this non-flat response) doesn't give the desired results.
I can share some articles on this if it helps, but basically a number of good researchers examined how humans choose preferred response curves and found a consistent trend, we like an upward tilt in the bass, with a downward tilt in the treble. In total a tilt of 10db's from 20hz to 20khz. The bass should be 10db's louder than the treble, if that makes sense. This has become a fairly standard way to eq a system, but...there are a lot of variations that are acceptable within that, and...you may like something altogether different. Some have suggested that older individuals with age related hearing loss may prefer a brighter system to compensate for the hearing loss. That hasn't been extensively studied but is certainly possible.
I would not EQ flat with a graphic EQ as you mention to be honest. These devices have a number of problems with ensuring good sound. The first is that the 1/3 bands are too course and too inaccurate to be used to remove the effects of room modes. They really shouldn't be used to correct bass problems. PEQ is the preferred choice. Above the Schroeder frequency they are likely to cause a number of issues:
Too course to flatten response
Too narrow of bands to not cause positional response anomalies (i.e. if you move your head the response changes for the worst drastically)
If analogue may cause non-symmetric changes due to quality problems in eq sliders (these older type potentiometers aren't linear, if dual channel are often not balanced at all levels. Even if you have separate dials for each speaker, it needs to be precisely correct on each channel to not risk throwing off left right balance).
My general rule for most people to follow with regard to EQ is to NOT eq above the Schroder frequency. It is much more preferable to use a modern EQ system like DIRAC, which relies on precision digital filters which are, largely, FIR based above the Schroeder frequency. This ensures that both phase and amplitude are corrected and done so precisely. It also ensures that the deviation position to position is minimal, things are not made worse. This isn't true with typical manual eq approaches. Here is a quick run-down for how to eq above the Schroeder:
EQ above the room's transition zone must be done based on free space measurements of the speaker. It should be used to correct the speaker and not the room. The room cannot be corrected by this type of EQ in this way and only serves to make things worse. Free space measurements means either outdoors, Anechoic Chamber, or very precisely made measurements indoors with gating.
EQ does not need to be symmetric above the Schroeder, you can EQ each speaker individually. Speakers should be as matched as possible, but variation is expected. EQ can be used to correct for this variation. However, variation caused by the room should not be corrected. Again, EQ should be based on free space measurements, which is why trying to EQ each Left and Right speaker to match each other in a room is a bad idea. It just can't be done well. DIRAC is an exception because it uses such a different approach. If you do measure a speaker in free space and decide to apply EQ, it is important to ensure that the left and right speakers final measured response matches each other very closely.
Attempting to create a house curve in the response DOES need to be done based on in room measurements, but the use of graphic EQ is a non-ideal way to do this. As long as the graphic EQ is applied perfect symmetrically you could give this a try. I would base the correction on a number of measurements and check it very carefully.
Before jumping into this, I would suggest taking a 3 measurements of the left speaker and 3 measurements of the right speaker. Each measurement should be in a different location about the listening position (matched for left and right) and about 12-24 inches apart. Share those measurements (please label each measurement position such as "Center head" or "Left of Head"). That will help me see what your speakers naturally do and provide the best guidance. Most speakers naturally roll off on a room, so in many cases the only EQ needed is in the bass to get the desired slope.
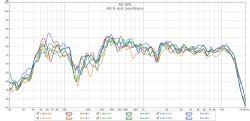
Speakers which have a lot of off-axis problems are, in my opinion, problematic speakers. However, if you drew this conclusion after applying EQ with the graphic EQ, it may have been caused by that. As I said, applying EQ above Schroeder can actually make a speakers response vary with position a lot more and this can be bad. To understand why, take a look at this measurement of my speakers measured at the listening position in various places around where my head would be. This measurement has Dirac eq, that 37hz dip for instance is completely an eq issue (red line is with no eq):
Notice that once you get past 100hz or so the response starts to vary measurement to measurement in more random ways. Where there is a dip in one measurement there is a peak in another. Take 250hz for instance, if you filled that in with eq, we would see a big peak of 10db's in all the other measurements, even though two showed a dip, because the other 4 showed a flat response. We see this same variation in numerous places.
• I've read several articles on the need for a tilted response curve, including Harman's recent testing and the original B&K work. It does seem to apply to some extent in my room, based on experimentation; it's not terribly reflective and except for one or two LF modes appears well behaved in terms of impulse and reverberant responses. It seems that I'm fairly sensitive to balance between the low and high parts of the spectrum, though, so I'm not sure whether mine will end up being 10 dB or perhaps somewhat less. I'll look at where it ends up once I get the balance to my satisfaction.
• After some tests (just trying to get comfortable with the REW EQ functionality while I waited), it looks like I may not need much EQ at all above 1 KHz anyway; I think the main problem is that I attempted to measure at one position, and it unduly biased the measurements. I tried averaging the measurement over slightly different mic positions and found that the EQ curve which seemed closer to the balance I was looking for didn't deviate much from the non-EQ measurement, roll-off and all. I'm pretty sure, based on what I saw, that any issues above 1K (perhaps even some below that) are just measurement artifacts and certainly not room-related. Therefore the question of whether a GEQ would cause problems on the high end may very well be moot. Not sure exactly where the Schroeder frequency is in my room, but comparison of multiple measurements suggests that it's probably around 250 Hz; that's where measurements seem to start converging in averaged tests.
• The plan is to use a DSP to work with any issues in the lower part of the frequency spectrum, not the GEQ, so that's not a problem. I'm pretty much ignoring bass issues until the new subwoofer arrives; things will change a lot at that point.
• I can certainly run off some measurements today; questions about the tests:
(1) When averaging, I moved the mic in a sort of large "bubble" around the head position. Do the L/R measurement spaces need to be horizontal as well as vertical, to get a good sense of the variance?
(2) Should I use minimum/no smoothing to capture all the details, or is 1/12 octave smoothing adequate?
I'll play around with the system and try a few "learning experiments" until then. 90% of this seems to be understanding how to make useful measurements which correlate to the perceived system response, and I'm getting better at that.
You want variation in the X, Y, and Z axis to capture the variation. Microphones don't precisely measure what we hear, so this helps.
No smoothing can't be interpreted, you need some smoothing. I use 1/12 and think that is fine. At a certain point the variation you see isn't audible. It is easily arguable that 1/12th shows detail we can't hear, but if you know what you are looking at, I don't see that as a big issue.
As for EQ, I really would be careful about eqing above 250hz. I would also say that if your room truly isn't very reflective, that your Schroeder frequency must be lower than that (unless its a really tiny room). If you want to eq between Schroeder and 250hz, maybe let us help you by providing measurements taken in a particular way.
OK, sorry about the delay - my subwoofer kit arrived and I've been working on it to the exclusion of most other duties. The system as tested is bi-amped, and of course no sub yet.
Rather than spend a couple of hours searching for the "best" location (I've been trying out a range of speaker and seating positions, as well as moving furniture) I just used the last location I tried as of Monday. I ran a test with each speaker individually driven, 3 positions for each test. The positions were 1: about 18 inches to the left and rear of MLP, 2: MLP; 3: 18 inches to the right and front of MLP. All were at the same height (there are some vertical directivity issues that I wanted to avoid, and I won't be doing any serious listening standing up anyway). They're labeled L1-3 and R1-3.
Some notes: The MLP for this test was unfortunate, because the ugly hole between 200-300 Hz is not present in most of my tests. Bad luck in this case. The hole at 135 Hz is almost certainly a room mode of some kind because it is there in every measurement. Also, the dip around 1300 Hz is probably tweeter phase related; it's near the crossover frequency and in some positions I've had to reverse polarity on the HF amp connections to eliminate that. I'm not concerned about it because it will go away when I decide on the proper MLP. Test L4 is somewhat different from the others, and I think that's due to some reflections between the left speaker and some flat surfaces - another reason this MLP is not a good one.
Hi Greg, I've split this off into its own post so we don't hijack the other thread.
I think these measurements look good. I agree that the dip between 1 and 2khz seems to be crossover related. There is a correct phase setting for the tweeter so I would suggest figuring out what it is and going with that. You could pull one of the speakers out into the middle of the room and take measurements at 2 meters. Then gate them and use that. You would want full polar response, meaning a measurement every 5 degrees off the zero axis.
We can certainly figure out what the big hole/dip is. Can you tell me what the speakers placement is? How big is the room, and how far are the speakers from the various room boundaries? If you want you can plug this into REW's room modeler to see what you get. You can then line up the peaks and dips with what you get. It won't be perfect but it helps. My guess is that a lot of that is SBIR or Speaker Boundary interference effect. The width is probably because your various dimensions are either fractions of each other or similar such that each dimension causes a set of interference patterns which either lie on top of each other or close. These are also fairly high in the bass register which implies to me that the room may be small? Is that right?
Yes, it's not hard to get the tweeters right - I've done it before, but whenever I move them the phase is certainly bound to change because the speakers (Magneplanars) are physically large. They're each 6 feet tall and 4 feet wide, so the tweeters are not too close to the mids. Angling them and curving the panels a little gives me a little more space, but they're honestly just a bit larger than the room will support properly.
They are currently spanning the room about 4 feet from the front wall; the room is only about 10-11 feet wide and about 25-26 feet long, so to keep the tweeters away from the wall (a couple of feet on each side) they are actually pushed together in the middle. Due to the large physical extent of the panels it's hard to simulate this with REW but the room sim settings I entered show a null about 135 Hz which is pretty close. Moving the speakers where they are and choosing the MLP a little closer to them than it currently was for the test does a fair job of minimizing that dip, but I can't seem to completely erase it. When I do that, the missing spectrum surprisingly isn't really obtrusive; it just sounds a little lean in the mid bass, and I'm fine if that's the only audible effect. I wish I had a choice of a larger room, but this is what I'm stuck with...
I don't have the sub installed yet, either - that was the measurement of just the panels by themselves. I may not be able to improve the low end much, but it's not as big of a concern as the balance of the overall response and that's why I was interested in making it as good as I can.
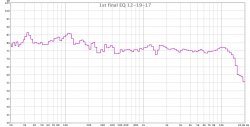
Well, I got the sub built and plugged it in. Happily, thanks to REW I was able to place it where it filled in some of the ugly nulls in the room response and things look much better now. There is still some minor tweaking to do, but overall I think I'm on the right path. The attached image is an averaged RTA measurement made at essentially the same positions as the prior tests.
This looks really good. I even like the general shape and slope. I suggest you use a full frequency sweep and not the RTA as it's noise performance is better and we can draw other information from the impulse response.
The rise at 100hz can probably be fixed by lowering the low pass filter on the sub. Just try experimenting. You may also need a high pass on the mains of low order. I personally prefer no high pass on the mains when possible but sometimes it's helpful to get good integration and does provide extra headroom on the mains. I do suggest trying to fix that only because it’s frequency has an impact on the perception of bass quality. It can make it sound bloated and flabby. By getting that rise flattened out the bass should sound better balanced and tighter. If t sounds weak after that just turn it up. Better to have the overall bass level higher than to have a response with a peak like that.
That peak in the response at 32hz or so can ve knocked down wjtg peq. I would prefer to use a proper measurement of the impulse for that. You want to take a few measurements in different locations to figure that out. If you want to optimize for a single seat you measure around your head in that single seat. Then take an average of those measurements. I also look at them individually before averaging them to be sure they each look ok. Sometimes you get weird nulls in a location that is maybe 1” over from a clean one. Might be a resonance or a weird reflection. When I get that I take more in that area and change location and height to be sure I am getting a reasonable representation. If it really is so specific in location that just an inch or two over or up or down the null goes away, I ditch that measurement and average the clean ones only.
The PEQ filter should be taken based on the averaged response and not be over about 150hz.
The mains do go down pretty low (40-50); I don't think a HPF makes a huge difference in actual sound but I'm still messing with it to see if it helps with room integration and averaged responses. transitioning to the sub below 60-80 certainly reduces the amount of power needed from the LF amp. Once I'm sure I have the best settings I'll try adjusting the low band PEQ to improve response further.
I'll be back with an impulse graph eventually; interestingly, by moving the mic to different locations I can see the L/R separate responses in time which is something I didn't really expect. They're clean with almost no ringing. I think this might be partly because I have the HPF on the mains and am adjusting the sub phase, but more testing is needed.
The PEQ only goes up to 200, so I'll be using it to take care of deviations well below that.
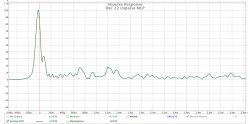
With most of the final EQ trimmed out for the MLP, I'm pretty happy with the impulse response. I think the secondary peak in the signal is probably due to the fact that I have 3 panels generating wavefronts, and they're not all equidistant from the mic. If I have time, I may experiment with panel positioning to see if I can get the traces a little closer without impairing the stereo image.
With most of the final EQ trimmed out for the MLP, I'm pretty happy with the impulse response. I think the secondary peak in the signal is probably due to the fact that I have 3 panels generating wavefronts, and they're not all equidistant from the mic. If I have time, I may experiment with panel positioning to see if I can get the traces a little closer without impairing the stereo image.
I wouldn't worry to much about it. That isn't being caused by your panels. The double hump is something either speaker related or in very close proximity to the speaker. That double hump is showing up less than 1/4" from the original impulse. It's more likely a speaker response delay between Tweeter and Midbass or a diffraction effect maybe. I've honestly never looked at an in room ETC that zoomed in.
I usually zoom out on my ETC's and look over a full 25-50ms or so. This is then long enough to account for the strongest reflections even at oblique angles. That reflects 57 feet (50 ms). The panel's (as absorbers) should make peaks off reflections lower, not add additional peaks. That would only happen if they had a solid back and or were diffusers that weren't against a wall. In that case they could create a new reflection other than the typical first reflections.
Just in case you aren't already familiar with this, when trying to track the source of the reflections, you look at the distance between you and the speaker. A reflection shows up as a blip in the ETC. Convert that time to distance using an online calculator or phone app calculator. Then figure out which reflective surfaces create a fly time that would be that much longer, as in, the difference in the distance between the direct path and the reflected path equals the distance of the blip. There are also techniques that people have used based on multiple microphones or by using figure 8 pattern mics that have a portion of the surface covered and this allows them to figure out the direction. I'll be honest, I've never learned this approach myself and find the hand calculation approach works in small rooms. I think in a large theater such techniques make sense (when there could be lots of reflections at similar distances coming from different angles), but in a small room, there is typically only going to ever be one place that a strong reflection at a given distance could come from.
Here is one as an example if this helps:
1.58 ms equals 1.8 feet. That is floor bounce as it closely matches the difference in distance between bouncing off the floor and then to the mic vs the direct path, given the mic's location.
5.52 ms is 6.28 feet. That is the ceiling bounce. The ceiling is treated but I intentionally didn't treat the actual first reflection point for the second row of seats (where I measured) so I could add diffusers later on, hence its very strong.
There isn't an obvious sidewall bounce and that is due to the acoustic panels. If you remove the panels it shows up roughly in the same place as where the floor bounce is. The distance to the side wall and the distance to the floor is very similar. I believe that is why the floor bounce is a little ragged and wide.
One of these days I should write up how to do all this manually with pictures. It's hugely useful and not all that hard to do, it's biggest issue is that you usually need a friend to help you.
So once you have figured out the reflections, something else you can do is window the measurements so that the zero point is at the reflection peak and the window on the left side removes the original signal. You can leave the right side long. This roughly (very roughly) gives you a crude measurement of the response of the reflection.
I wouldn't worry to much about it. That isn't being caused by your panels. The double hump is something either speaker related or in very close proximity to the speaker. That double hump is showing up less than 1/4" from the original impulse. It's more likely a speaker response delay between Tweeter and Midbass or a diffraction effect maybe. I've honestly never looked at an in room ETC that zoomed in.
It's almost certainly one of the other panels of that speaker, I think - the shape is almost identical and at a fixed delay. Since the adjacent panels are fed by amps which are crossed over at a single frequency, the two panels would probably give a similar shaped impulse but with different amplitudes (more of a mechanical "filtering" effect, since the response is much wider than the input signal). A diffraction signal would probably vary irregularly in shape with angle of incidence since the speaker frame is rectangular; there may be some of that in the early reflections but it all looks like noise, 20 dB or so down.. The other speaker set is visible as a near-copy of its partner at varying delays if you move the measurement mic from side to side.
I usually zoom out on my ETC's and look over a full 25-50ms or so. This is then long enough to account for the strongest reflections even at oblique angles. That reflects 57 feet (50 ms). The panel's (as absorbers) should make peaks off reflections lower, not add additional peaks. That would only happen if they had a solid back and or were diffusers that weren't against a wall. In that case they could create a new reflection other than the typical first reflections.
Yes, the reasons I didn't show the full graph out to 20 mS or so are (1) to show what I think is a very clean impulse response and (2) the only notable waveforms out beyond a few mS were clearly identifiable reflections from wall, ceiling, etc. (and the other speaker when I ran the test through both of them). I'm comfortable enough with matching those to the room dimensions to be able to work out which was which. I can post them, of course, if anyone is interested; but to me they weren't as interesting as the raw impulse, they're just things that need to be reduced or eliminated if possible.
It's almost certainly one of the other panels of that speaker, I think - the shape is almost identical and at a fixed delay. Since the adjacent panels are fed by amps which are crossed over at a single frequency, the two panels would probably give a similar shaped impulse but with different amplitudes (more of a mechanical "filtering" effect, since the response is much wider than the input signal). A diffraction signal would probably vary irregularly in shape with angle of incidence since the speaker frame is rectangular; there may be some of that in the early reflections but it all looks like noise, 20 dB or so down.. The other speaker set is visible as a near-copy of its partner at varying delays if you move the measurement mic from side to side.
Yes, the reasons I didn't show the full graph out to 20 mS or so are (1) to show what I think is a very clean impulse response and (2) the only notable waveforms out beyond a few mS were clearly identifiable reflections from wall, ceiling, etc. (and the other speaker when I ran the test through both of them). I'm comfortable enough with matching those to the room dimensions to be able to work out which was which. I can post them, of course, if anyone is interested; but to me they weren't as interesting as the raw impulse, they're just things that need to be reduced or eliminated if possible.
Oh I'm sorry, I misunderstood what you meant by panel. I was thinking acoustic treatment panel. Yes that makes sense. The speaker panels certainly could be the cause.
This site uses cookies to help personalise content, tailor your experience and to keep you logged in if you register.
By continuing to use this site, you are consenting to our use of cookies.


 The system as tested is bi-amped, and of course no sub yet.